
 Bunlings: sprint apps for Jira





Every team has a work item like this. It was “just a small change”. It got a 3. It took eleven days, two reviews and one long chat about the orders table. At the retro someone writes “estimates were off again” on a card, everyone agrees, and the next sprint starts with another “just a small change”.
The guessing was not the problem. The missing part was looking back.
Why are our estimates always wrong?
Because most estimating only looks forward. A 5 is a feeling about size, and that feeling is only as good as the last time anyone checked it against what actually happened.
Four things quietly push a team’s numbers off:
- The first number wins. Someone says 8 out loud and the room adjusts around it. Hidden votes help, because nobody can anchor on a number nobody has seen yet. More on this in estimation anti-patterns.
- A 5 is not the same 5 for everyone. A new developer’s 5 and a senior developer’s 5 may be different sizes, and nobody has said so out loud.
- The work changes in flight. A work item grows, gets split or waits in review. The estimate stays frozen at what you knew on day one.
- Memory is kind. The smooth work feels normal. The work that dragged feels like bad luck, so it never teaches anything.
None of this is a character flaw. It is what happens when the feedback is missing. The good news: the feedback is already sitting in your Jira.
Does Jira tell you how long a 5 actually took?
Not directly. Jira’s reports are good at totals and quiet about “how long did a 5 actually take”.
The Velocity Chart shows, for each sprint, the total estimate your team committed to and the total it completed. You find it under Reports in the sidebar of a scrum space. That answers “how much do we finish”. It does not answer “when we say 5, how long does it take”. How to read the Jira velocity chart covers where it misleads, and Bunlings Sprint History shows what each size took on your board.
You can get there by hand:
-
Go to Filters in the sidebar and open Search work items (some sites still call it Advanced work item search). Switch to JQL and paste:
statusCategory = Done AND "Story point estimate" = 5 AND resolved >= -26wSome sites name the field Story Points instead. Use the name your site shows.
-
Add the Resolved column to the results. For a few work items, open History to see when each moved to In Progress. The gap between the two is what the 5 took. Count working days, so a 5 that crossed a weekend does not look bigger than it was. (Created is a poor start date: it includes the weeks the work item waited in the backlog.)
-
Do the same for your 3s and 8s.
-
Put the three sets side by side.
It works. It is also the kind of job that gets done once, in a quiet week, and never again.
What should you look for in the numbers?
Three things: the range, the overlap and the surprises.
| Look at | The question | What it tells you |
|---|---|---|
| Range | How long did your finished 5s take, quickest to slowest? | What a 5 means on this board, in days |
| Overlap | Do your 5s and 8s take about the same time? | Whether the gap between those sizes is real |
| Surprises | Which work items landed far from their size, and why? | The one thing worth raising at the retro |
Two honest caveats. A range describes work you already finished, not next sprint. And six finished 5s is a hint, not a law.
How do you check your estimates in ten minutes a sprint?
Once a sprint, see what your sizes took, then carry one finding into the next estimation session. Four steps:
- Pull the finished work. Everything the team completed in the last few sprints, with its estimate and how long it took.
- Group by size. Which work items were 3s, 5s and 8s?
- Find the odd ones out. A 3 that took two weeks. An 8 that took two days. These are the useful ones. Every board has a few, and they often started with the word “just”.
- Write one line. For example: “Anything touching the orders table is bigger than it looks.” Put it where the next estimation session will see it.
The last step matters most. A finding nobody sees at the moment of estimating changes nothing.
Keep it small: ten minutes, three odd ones out, one line. If the check takes an hour, it will not survive a busy sprint.
Will this make our estimates accurate?
No, and nothing honest can promise that. Estimates are guesses about work nobody has done yet.
What the habit does is shrink the gap between what you assume a 5 means and what your 5s have actually taken. You still guess. You just guess with the evidence on the table instead of in someone’s memory.
Run it for three sprints, then look at what the odd ones out have in common. That pattern is usually the real lesson.
What does this look like in Bunlings?
In a Bunlings estimation room you point at a card, and the history is already there. The panel shows how long work with that estimate actually took on your board, worked out from your own finished work items.
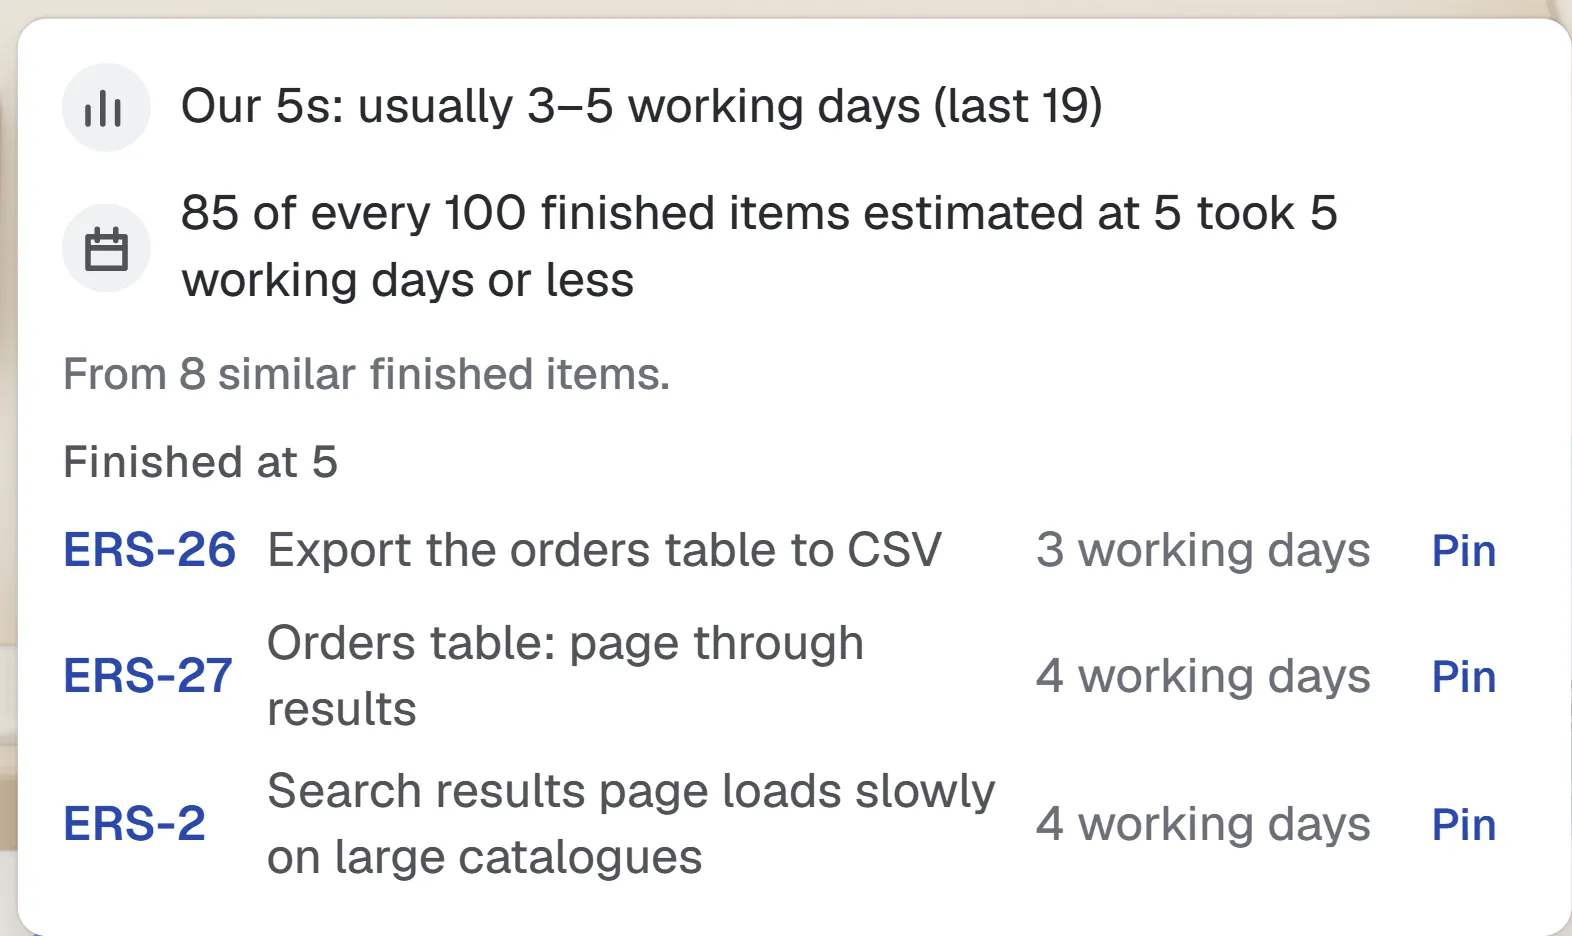
Pointing at the 5 card in a sample team’s room. Work items and numbers are sample data.
Each line says how many finished work items sit behind it (19 recent 5s for the range here), so you can see how thin or solid the sample is. It reads finished work, so it shows the past, not a promise about the next item. It opens when you hover over or focus a card, and it does not appear on phones.
That is steps 1 and 2 of the ten-minute check, shown at the moment you need them. Nobody builds a filter or opens a spreadsheet. The 5 card just tells you.
The cards stay face-down until the reveal, so the first number in the room is not simply the loudest one. When the team agrees, one click on Agree saves the number to the board’s own estimate field, as you, with 10 seconds to undo.
Where does the retro fit in?
The retro is where “why was that one off?” gets answered, as long as the retro knows what was estimated.
When estimation and retro live in two separate places, the retro starts from a blank board and everyone tries to remember which work items were the problem. In Bunlings the retro opens with facts from the sprint’s estimates. In the sample below, one work item came out bigger than the team thought (5 to 8), and one person had voted 8 all along.
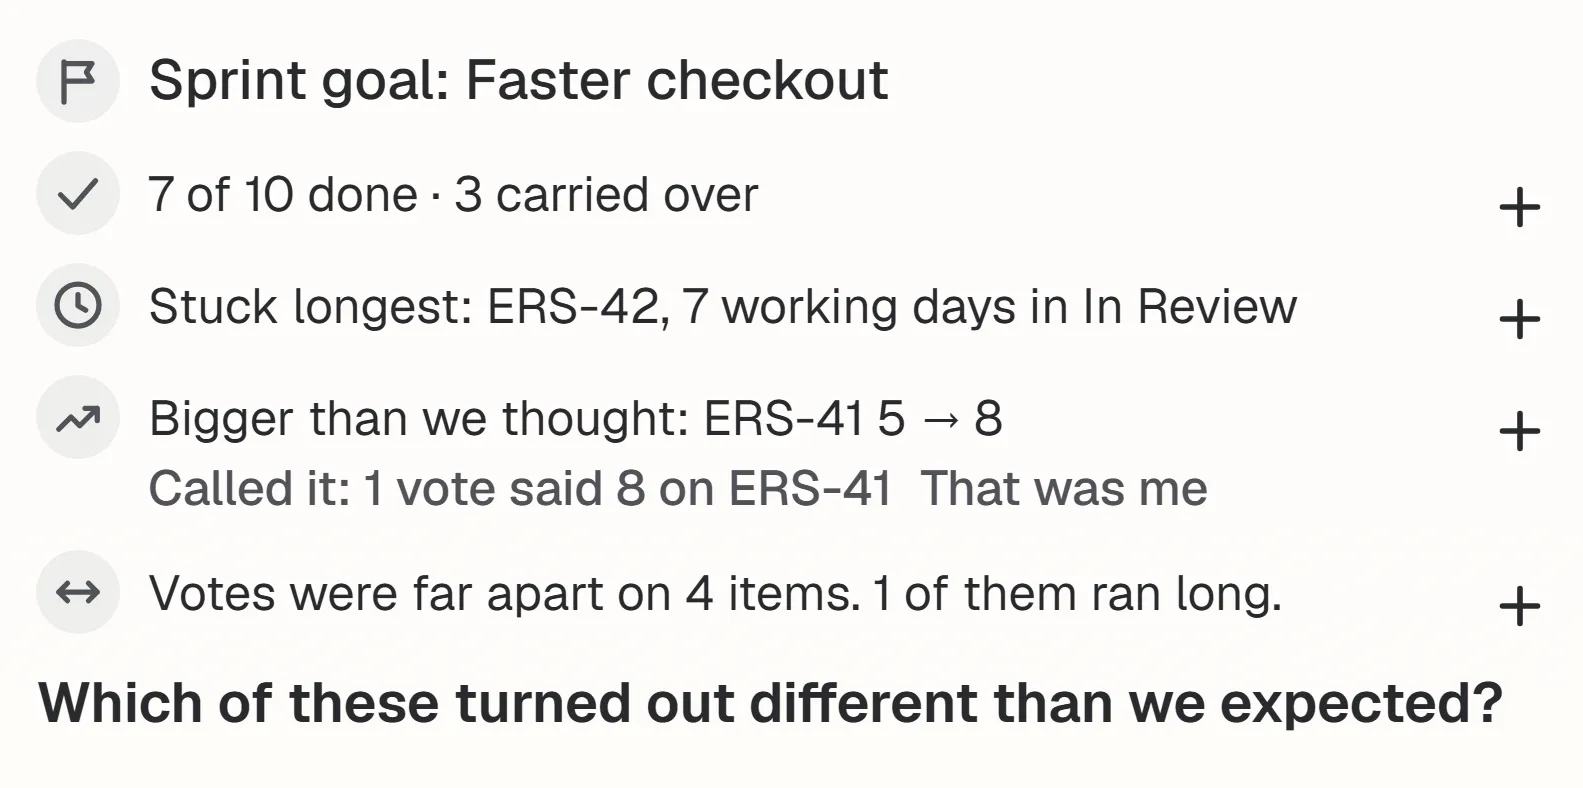
The facts at the start of a sample retro. All work items and numbers are sample data.
Each fact has a plus button, so one click puts it on the board as a card for the team to discuss. Cards stay hidden until someone presses Show all, so people write what they think before they read what everyone else wrote. Then the panel asks the question that matters: which of these turned out different than we expected?
From there, pin the lesson. “Anything touching the orders table is bigger than it looks” can then show on the next work item with the same component, label or epic, instead of living in one person’s head.
Where to go next
- Story points explained: what a 5 is, and how Fibonacci and T-shirt sizes differ.
- Votes far apart in estimation: what to do when the room says 3 and 13.
- Estimation anti-patterns: anchoring and its relatives.
Try Bunlings
Bunlings: Scrum Poker & Retrospectives for Jira runs inside Jira Cloud. Your board already has a room: open the menu on a sprint and its work items are there. No outside servers, no new login. Free for up to 10 users.