
 Bunlings: sprint apps for Jira





The bars say 24, 31, 27, 19, 29, 26. Someone asks for “our velocity” and you say 26. It is a fine answer, as long as nobody asks what it is made of.
Here is how to read the chart, in a minute, and the handful of spots where it nudges you towards the wrong story.
What does the Jira velocity chart show?
For each of your most recent completed sprints, it shows two bars and one line.
- Commitment (grey bar): the total estimate of the work items in the sprint when it started. Work added later, and estimate changes made later, are not in this bar.
- Completed (green bar): the total estimate of what was completed when the sprint ended. Unlike the grey bar, this one includes work that joined after the start.
- Average (black line): the average of the completed bars across the sprints shown.
The unit comes from the board’s estimation setting: Story Points, original time, a numeric field, or work item count. The chart is available for Scrum boards in company-managed spaces. Atlassian describes all of this on its velocity chart page.
How do you open it?
- Open your board in a company-managed Scrum space.
- Choose Reports in the space navigation.
- Choose Velocity Chart.
Jira counts a work item as done when its status maps to the board’s right-most column. If your “Released” status sits in a column to the right of “Done”, or your done status sits in the middle, the green bar counts something other than what you meant. Check the column mapping once in the board settings.
How should you read it?
As a range. A single average hides the thing you actually want to know: how much the team’s finishing varies from sprint to sprint.
Take a made-up team with these completed bars over six sprints: 24, 31, 27, 19, 29, 26.
| Value | |
|---|---|
| Average (the black line) | 26 |
| Lowest sprint | 19 |
| Highest sprint | 31 |
| Honest thing to say at planning | “Usually 19 to 31, about 26” |
“About 26” invites a plan for 26. “19 to 31” invites a conversation about what happens if it is a 19 sprint. The second one is the one that survives contact with a real sprint.
One more check worth making: look at how often the green bar reached the grey bar. A team that finishes most of what it commits to has a different planning problem than one that does not.
Where does it mislead?
Five places.
- Green above grey does not mean you beat the plan. The grey bar is frozen at the start. The green bar counts everything completed, including work that joined later. A sprint that committed to 30, took in 8 more and finished 32 shows green above grey, while 6 planned points did not finish. Many Community questions about “completed higher than committed” come down to this. More in work added and removed mid-sprint.
- The average treats every sprint alike. A sprint with a holiday week, or half the team away, pulls the line down. A sprint that took in a pile of extra work pushes it up.
- Estimate changes are invisible. A 3 that turned into an 8 mid-sprint is not in the grey bar. The chart does not tell you it happened.
- Sub-tasks do not count. Only the estimates on parent work items are included. If your team estimates on sub-tasks, the chart can look empty.
- It only sees what the board’s filter sees. Work that matches the board’s saved filter is in. Anything else, however busy people were, is not.
None of these makes the chart wrong. They make it a summary, and a summary leaves things out.
Quick checks before you quote a velocity
- Open one sprint in the Sprint Report and look for the asterisks that mark work added after the start. It takes a minute per sprint. The sprint report explained shows what else is on that page.
- Leave out sprints that were not normal (holidays, an incident), and say you did.
- Quote a range, and say how many sprints it covers.
Want to turn the range into a finish date? Velocity vs throughput for sprint planning shows the arithmetic.
Where does Bunlings Sprint History fit in?
Bunlings Sprint History is a Jira app that draws the same history in a way that separates the plan from the extras. It is read-only, and it does not replace Jira’s reports.
Each sprint is a jar. The outline is the plan at the start, the fill is what finished from that plan, and a dotted block on top is work that joined later and finished. A grey band shows your usual range. The headline sentence says what the team usually finishes, as a share of its plan.
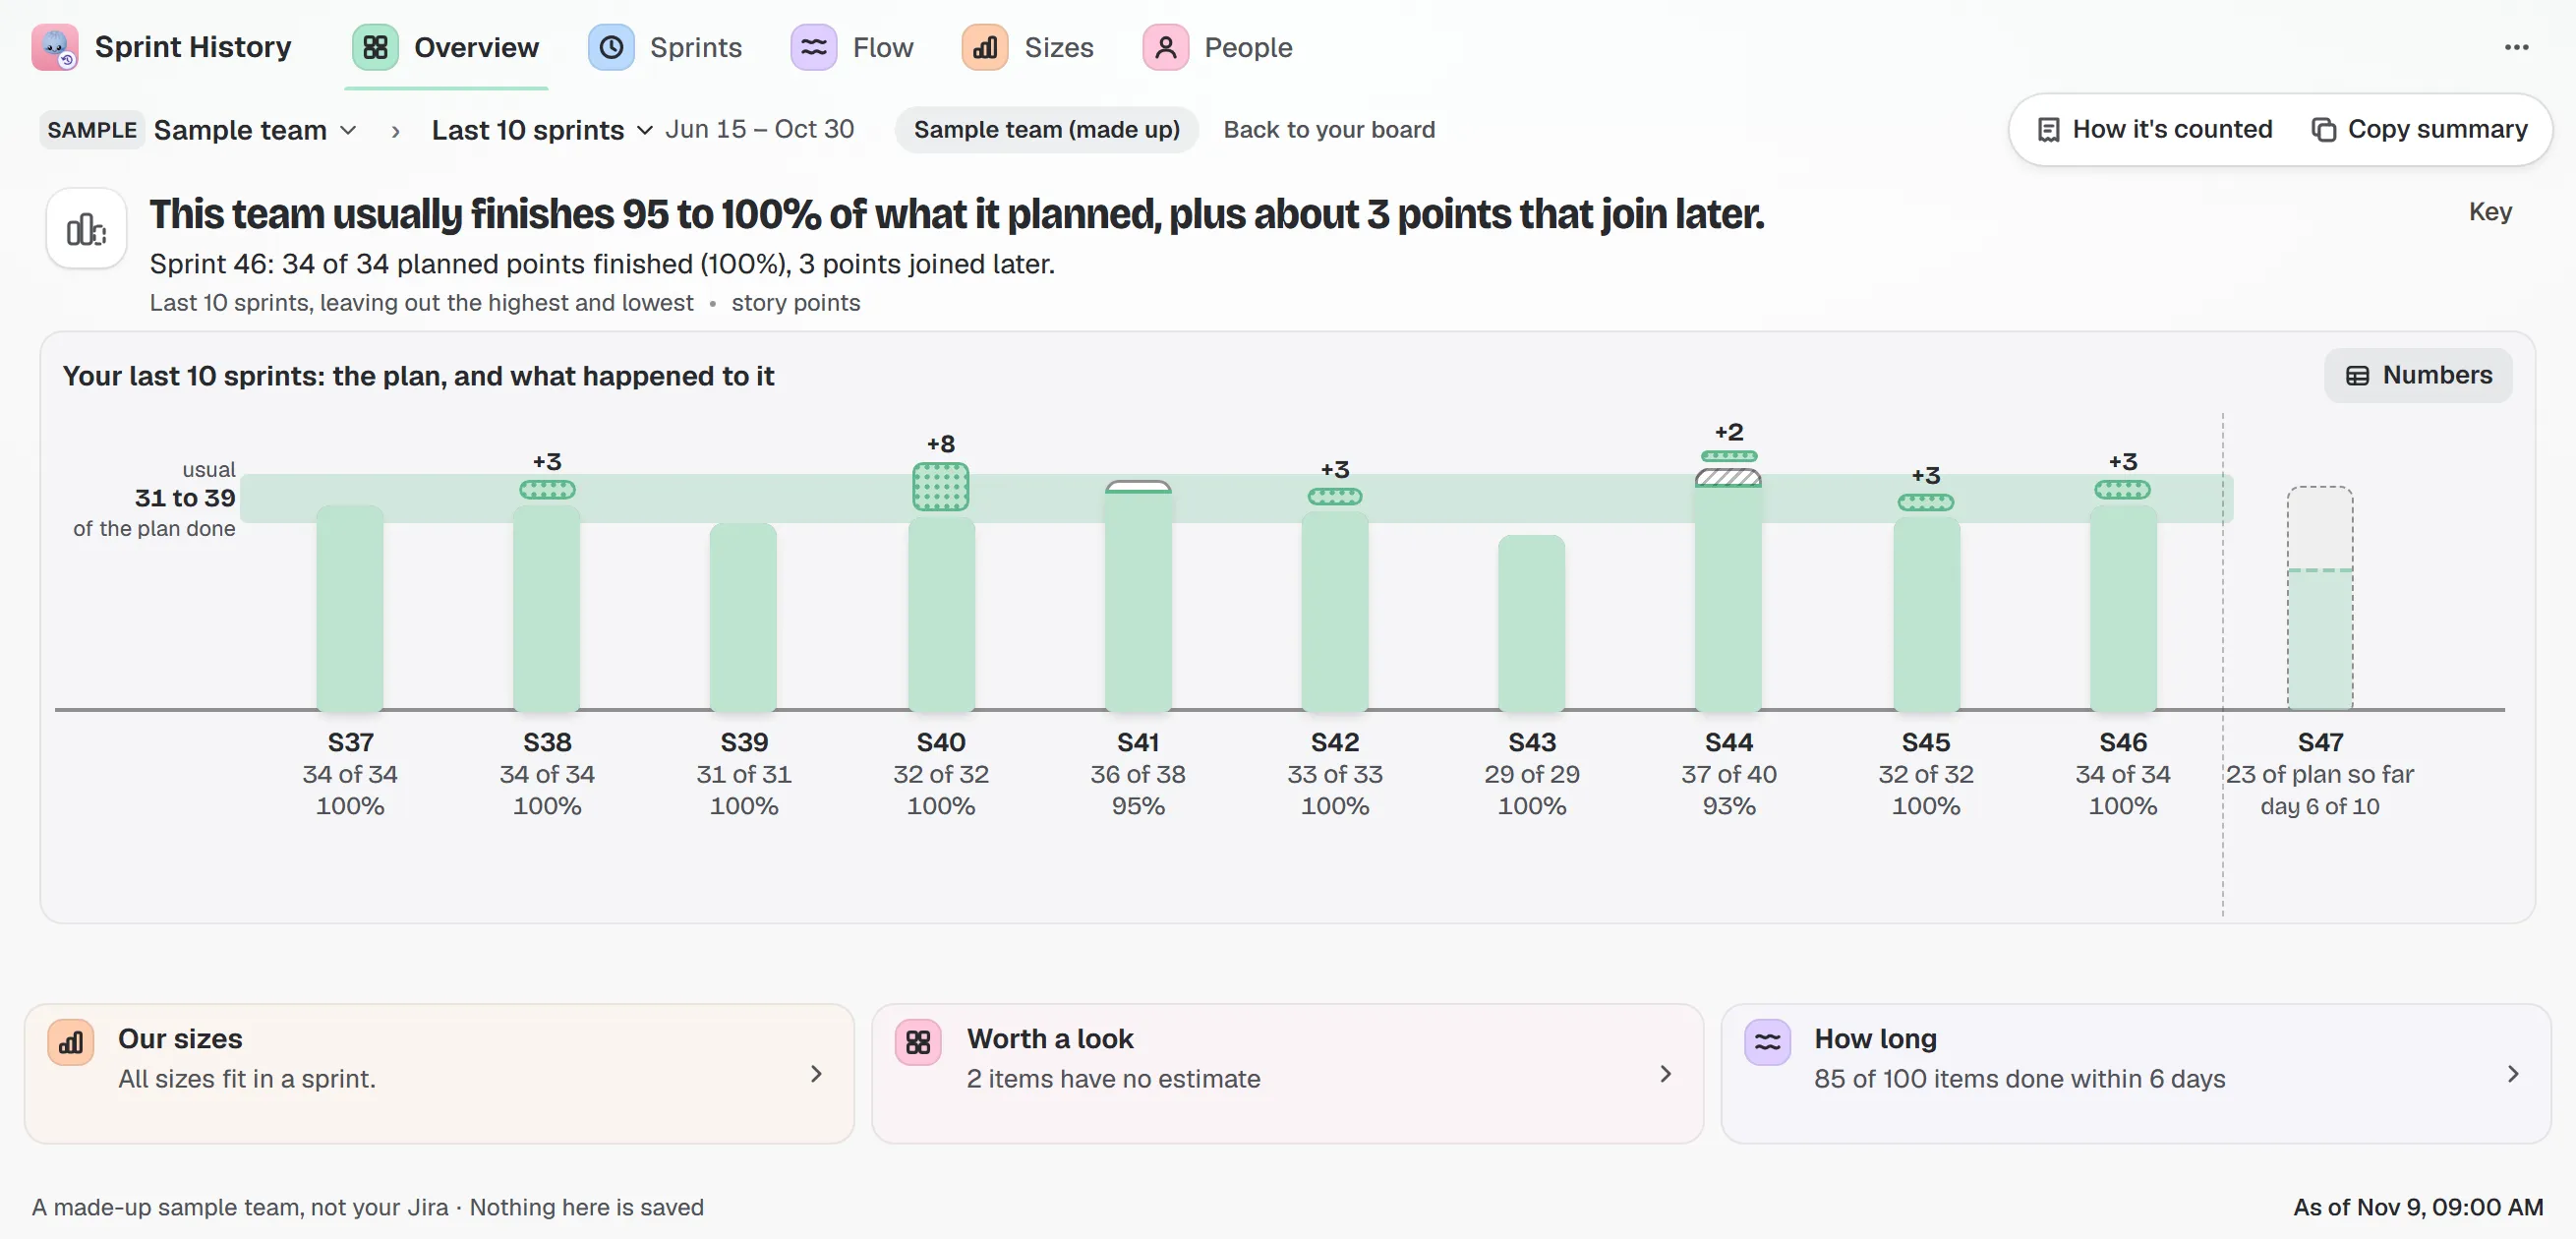
Sample team and sample data. Each jar is one sprint; the dotted block on top is work that joined later and finished.
Click a jar and the sprint opens: what was planned, what finished, what joined later, what was taken out, with the work items behind each number.
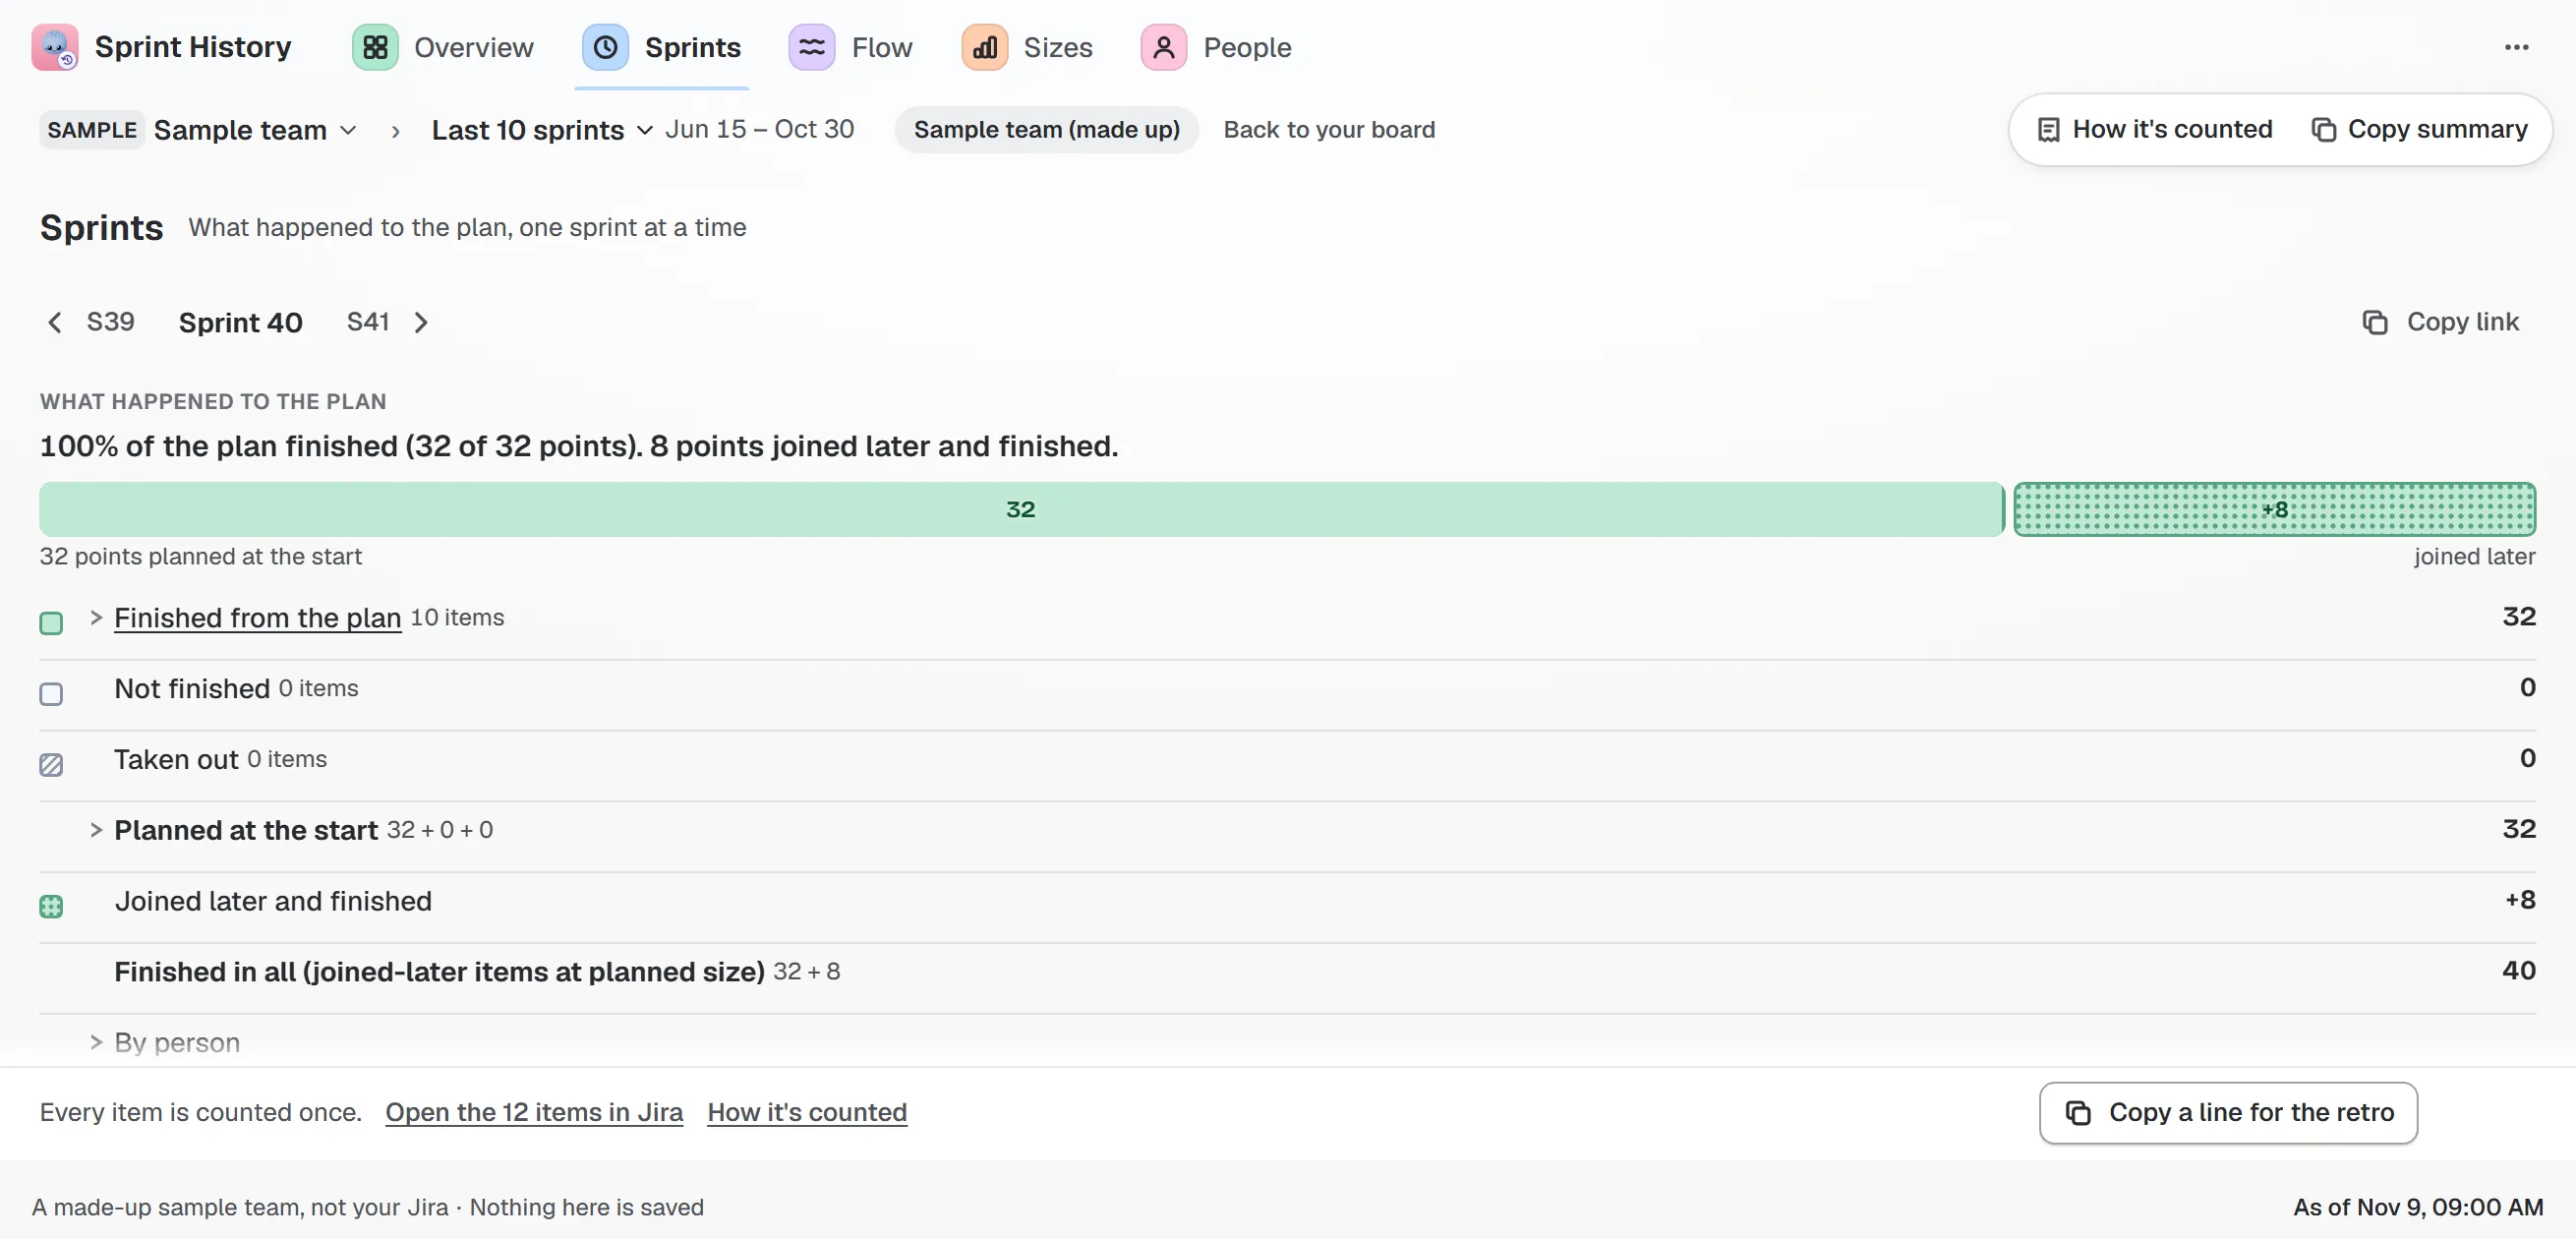
Sample team and sample data. “100% of the plan finished (32 of 32 points). 8 points joined later and finished.”
If the number differs from what Jira’s own report likely shows, a line says why and lists each step. The guide to reading the charts goes through every mark.
Try it
Sprint History runs inside Jira Cloud and has a free edition for one board.