
 Bunlings: sprint apps for Jira





Sprint planning, 10:04. Someone asks “how much can we take on?” Velocity says 21 points. Throughput says 7 work items. Both are right, right up until one of those work items turns out to be secretly huge.
Short version: velocity adds up your estimates, throughput counts finished work items. Here is when each one earns its seat at sprint planning, and how to read both in Jira without a new tool.
What is velocity?
Velocity is the total estimate your team finishes in one sprint. Finish work items estimated at 5, 3, 8 and 5, and that sprint’s velocity is 21.
Jira’s Velocity chart shows it per sprint: one bar for what the team committed to, one for what it finished, and a line for the average across the sprints shown. The chart lives in scrum spaces only, not Kanban.
Velocity has one main ingredient: the estimates. When a 5 means roughly the same thing every sprint, velocity is a handy yardstick. When a 5 is sometimes two days and sometimes two weeks, the total hides it. A 5 that took two weeks still counts as 5. Velocity is very forgiving that way.
What is throughput?
Throughput is how many work items your team finishes in a set period: a week, a sprint, a month. No estimates, no sizes, just a count.
Say a made-up team finished 6, 9 and 7 work items in its last three weeks. Its throughput is 6 to 9 a week, about 7 on average. That is the whole calculation. Nobody argued about whether anything was a 3 or a 5.
It sounds too simple to be useful. It holds up when your work items are roughly the same size, and falls over when they are not.
Velocity vs throughput: what is the difference?
Velocity measures estimated work finished. Throughput measures work items finished. Everything else follows from that.
| Velocity | Throughput | |
|---|---|---|
| What it counts | Total estimate finished | Work items finished |
| Needs estimates | Yes | No |
| Typical unit | Story Points per sprint | Work items per week or sprint |
| Works on Kanban | Not in Jira’s Velocity chart | Yes |
| Weak spot | Only as honest as the estimates | Treats a tiny work item and a huge one the same |
| Good question for it | “How many points fit in this sprint?” | “How many work items by the 24th?” |
Neither one is a team score. Both only describe what already happened.
When should you use velocity?
When your team already estimates, runs sprints, and a 5 this sprint means about the same as a 5 last sprint.
It also gives sprint planning a quick sanity check: “we usually finish about 21, and this plan says 30.”
The catch: velocity inherits every estimation habit your team has. If the first voice in the room sets the number for everyone, your velocity measures that voice. Hidden votes help, because everyone picks before hearing anyone else. There is more on that in Scrum poker in Jira.
When should you use throughput?
In three situations.
- Your team works in Kanban. There are no sprints and no Velocity chart, so a count per week is the natural measure.
- Your team does not estimate. Throughput gives you a forecast anyway.
- Your work items are all roughly the same size. Then estimating them adds a meeting and little else.
It is weaker when sizes vary a lot. One huge work item and nine tiny ones count as ten. Throughput does not do nuance. If that is your board, split the huge ones or keep estimating. Why estimates are off covers the usual reasons sizes drift.
How do you read velocity in Jira?
In the Velocity chart, under the board’s Reports. Three steps:
- Open the board of a company-managed scrum space (team-managed scrum spaces have their own velocity report).
- Go to Reports and choose Velocity Chart.
- Compare the finished bars with the committed bars, and check the average line.
The chart follows the board’s estimation setting: Story Points, original time, a numeric field, or work item count. Pick work item count and the same chart shows throughput per sprint. That setting changes the estimates for the whole board, though, so ask your board admin first and switch it back afterwards.
Read the bars as a range. If your last six sprints finished between 18 and 26, say “18 to 26”, not “22”.
How do you read throughput in Jira?
Count what you finished. This works on any board, scrum or Kanban. Paste this into the work item search (switch it to JQL):
project = ABC AND resolved >= startOfWeek(-4w) AND resolved < startOfWeek()That returns everything resolved in the last four full weeks. (JQL still calls a space project.) Divide the count by four for a weekly average, or move the dates one week at a time to see the spread.
Count looks too low? Your workflow may not set a resolution when work items move to Done. Try this instead:
project = ABC AND statusCategory = Done AND statusCategoryChangedDate >= startOfWeek(-4w) AND statusCategoryChangedDate < startOfWeek()For Kanban boards in company-managed spaces, the Control chart shows how long each work item took, which tells you whether past weeks are a fair guide.
Can you forecast a finish date from either one?
Yes, as a range. Divide the work left by your recent pace, once with a fast week and once with a slow one.
- Velocity: estimated work left, divided by velocity per sprint, gives a number of sprints.
- Throughput: work items left, divided by work items per week, gives a number of weeks.
The made-up team from above finishes 6 to 9 work items a week and has 36 left. 36 divided by 9 is 4. 36 divided by 6 is 6. So the answer is “four to six weeks”, and that is a much easier conversation than defending one date.
Neither number knows about a person leaving, a big holiday, or a surprise from production. Bring the window to sprint planning, not a promise. If you want that window with odds attached, Bunlings Sprint Forecast replays your past sprints on the plan, and Will we finish the sprint? shows how by hand.
Which one should your team pick?
The one that matches how you already work. A short test:
- Do you run sprints and trust your sizes? Use velocity.
- Do you run Kanban, skip estimates, or have mostly similar-sized work? Use throughput.
- Not sure? Track both for a month: the Velocity chart for points, the JQL count above for work items. No second tool, and no board settings to change.
Whichever you pick, leave out the unusual weeks (a holiday, a production fire), say which ones, and quote a range.
Where does Bunlings fit in?
Bunlings has no velocity or throughput chart, and it does not replace Jira’s reports. It is a Jira app for scrum poker and retros, and it helps with the weak spot of each one.
For velocity, the weak spot is the estimates. In Bunlings, votes stay hidden until the cards flip together, so everyone picks before seeing anyone else’s number. Agree saves the result to the board’s own estimate field, such as Story Points, with 10 seconds to undo. And every card shows how long that estimate actually took your team on this board, so you see whether a 5 means two days or two weeks before it goes into your velocity.
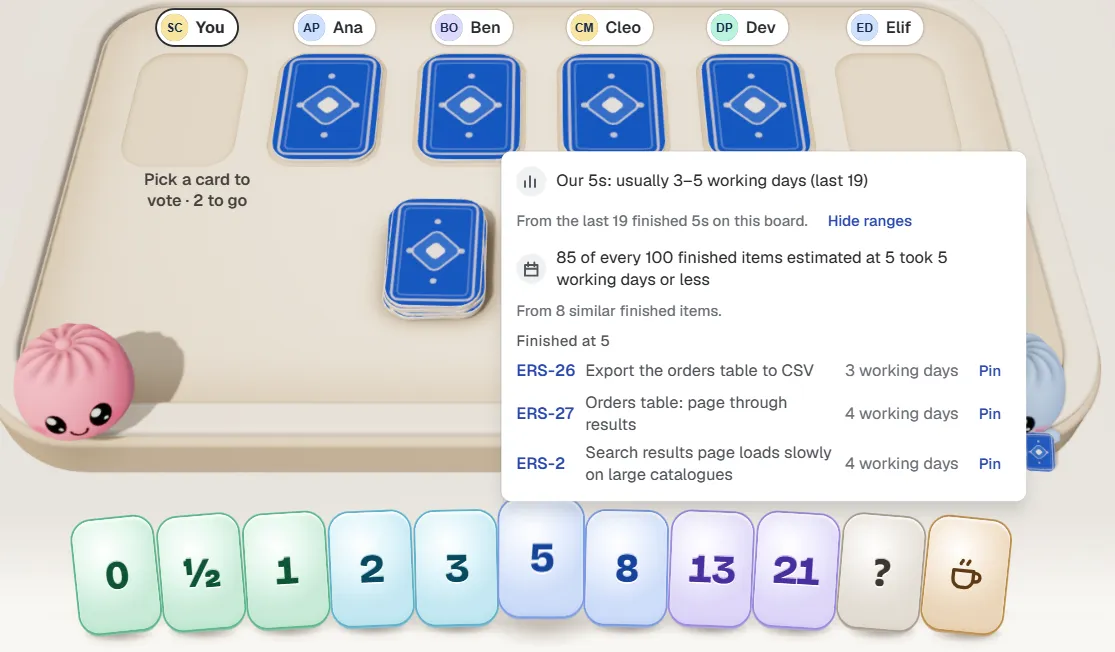
Sample team and sample data. “Our 5s: usually 3-5 working days (last 19)”, worked out from the finished 5s listed underneath.
For throughput, the weak spot is size: one huge work item still counts as one. On a Kanban board, the team votes Fits or Too big on each work item, so the giants get split before they hide in the count. The room then shows a likely finish date, worked out from the board’s own recent weeks. A Fits vote stays in the room and writes nothing to Jira.
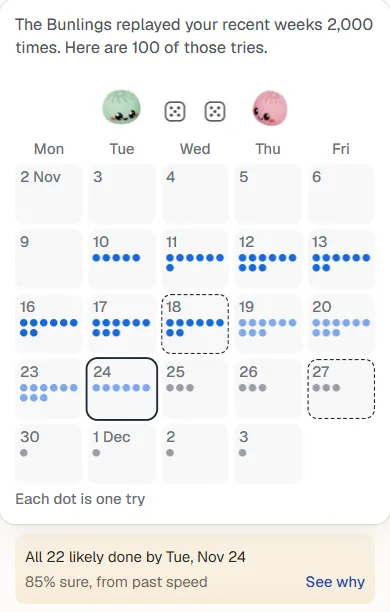
Sample team. “All 22 likely done by Tue, Nov 24”: each dot is one replayed try. A likely date is a forecast from the past, never a promise.
Saved estimates are searchable in Jira too, so “what did we agree this month?” is one search away. For more on forecasting without estimates, read Kanban forecasting without Story Points. For the whole app next to plain Jira, see Native Jira vs Bunlings.
Try it
Bunlings is free for up to 10 users and runs inside Jira Cloud.