
 Bunlings: sprint apps for Jira





“When will these 22 be done?”
Every Kanban team gets this question. It tends to arrive on a Thursday, from someone who needs the answer by Friday, and it lands on a board that has never used a story point in its life.
Good news: you do not need one. A few past weeks and one Jira filter are enough for an answer you can say out loud without crossing your fingers.
How do you forecast a Kanban board without story points?
Count how many work items reached Done in each of the last four to six weeks. Then pretend the coming weeks will look like those weeks, picked at random, and see how long the remaining work items would take. Repeat a few times and answer with the spread.
That spread is the forecast. It uses what your team actually finished, not what anyone hoped it would finish. A work item someone once called “a 3” and one they called “a 13” both count as one finished work item. Over several weeks the big and the small tend to even out, so the count is an honest measure of pace.
Is throughput the same as velocity?
No. Throughput counts finished work items. Velocity counts finished story points. One needs a tally; the other needs an estimate on every work item before the tally can start.
| Throughput | Velocity | |
|---|---|---|
| What you count | Finished work items | Finished story points |
| Needs estimates first | No | Yes |
| Time period | Any: a day, a week, a sprint | A sprint |
| On a Kanban board | Natural, no sprints needed | Awkward |
| Feels like | Tally marks on a whiteboard | Bookkeeping |
The sprint-planning side of this comparison has its own article: velocity vs throughput for sprint planning. This one stays on the Kanban side.
How do you count finished work items in Jira?
With a filter. Open Filters, choose View all work items, switch to JQL and paste this, with your own space key:
project = ABC AND statusCategory = Done AND resolved >= -7dJira Cloud moves menus around now and then, so the names may shift a little.
The number of results is last week’s throughput. For the week before, use resolved >= -14d AND resolved < -7d, and so on back. Write the counts on a sticky note. Four to six of them is plenty.
Three things to check before you trust the numbers:
- “Work item” is the new “issue”. Older docs and plenty of forum threads still say issues. Same thing, new name.
- “Resolved” depends on your workflow. If moving to Done does not set a resolution, the filter comes back empty. Open one finished work item and check. If it has no resolution, count status changes instead:
project = ABC AND status CHANGED TO Done DURING (-7d, now()), with your own Done status name. Atlassian’s advanced search documentation lists the other fields. - Quiet weeks are real weeks. Holidays, sick days and that week everyone fought one bug all count. Drop them and your forecast turns optimistic, and your Fridays turn awkward.
Jira Kanban boards also come with reports such as the control chart and the cumulative flow diagram, depending on your space type. They show how long work items took and where they pile up. Great for spotting a bottleneck. They do not hand you a finish date, though.
What does a worked example look like?
Say your last four weeks finished 4, 6, 3 and 5 work items. (Made-up numbers, just for the arithmetic.) That is 18 in four weeks, or 4.5 a week.
You have 22 work items left. The tempting answer is 22 divided by 4.5, about 4.9, so “five weeks”. That is one number wearing a certainty costume.
The quick way to see the spread is to try your slowest, your average and your fastest week:
| If the coming weeks look like… | Work items per week | Weeks for 22 |
|---|---|---|
| your slowest week | 3 | 7 to 8 |
| your average week | 4.5 | about 5 |
| your fastest week | 6 | about 4 |
So the honest answer is “probably five weeks, somewhere between four and eight”. People can plan around that. And when week seven arrives, nobody feels lied to.
How does replaying past weeks work?
Write each weekly count on a slip of paper and put the slips in a cup. Draw one slip for the first coming week, put it back, draw again for the second week, and keep going until the drawn counts add up to 22. Note how many weeks that took. Do it a few times and you have a range.
This is what people call a Monte Carlo forecast. The name is fancier than the maths.
By hand, ten or twenty replays are plenty to see the shape. Most land in the middle, a few run long, and those few are exactly the ones a single date would have hidden.
Why give a range instead of a date?
Because the real answer already has a spread, and a single date hides it. A date invites “but you promised the 25th”. A range invites “what could move it?”, which is a far better conversation to have on a Thursday.
A range also shows where the trouble is. If it is wide, your weekly counts are uneven, and the useful question becomes why.
Two things a throughput forecast cannot know:
- Bigger work ahead. It does not know the next 22 work items are chunkier than the last 22.
- People away. It does not know two people are out next month. Past weeks only describe past weeks.
What about work items much bigger than the rest?
They are the one real weakness of counting. Twenty small work items and twenty small work items plus one monster are not the same forecast.
The fix is cheap and old. Before you forecast, go through the remaining work items and ask of each one: “Is this about the size of what we usually finish?” If yes, it counts as one. If not, split it until it is. You are not estimating in numbers, only sorting into fits and too big. One quick pass over the list does it.
How does Bunlings do this inside Jira?
If you only want the dates for epics and releases, without the estimation room, Bunlings Sprint Forecast gives a likely finish date from your last weeks of finished work, and When will this epic or release be done? walks through it.
Bunlings is a Jira Cloud app for estimation and retros. Its Kanban room does both steps from this article: sort into fits and too big, then forecast.
The team votes on each work item: Fits or Too big: split. Fits means it should take no longer than this board usually needs; on this sample board, up to 7 working days. The cards stay hidden until the reveal, then flip together, so the loudest voice in the room does not get to decide what counts as too big.
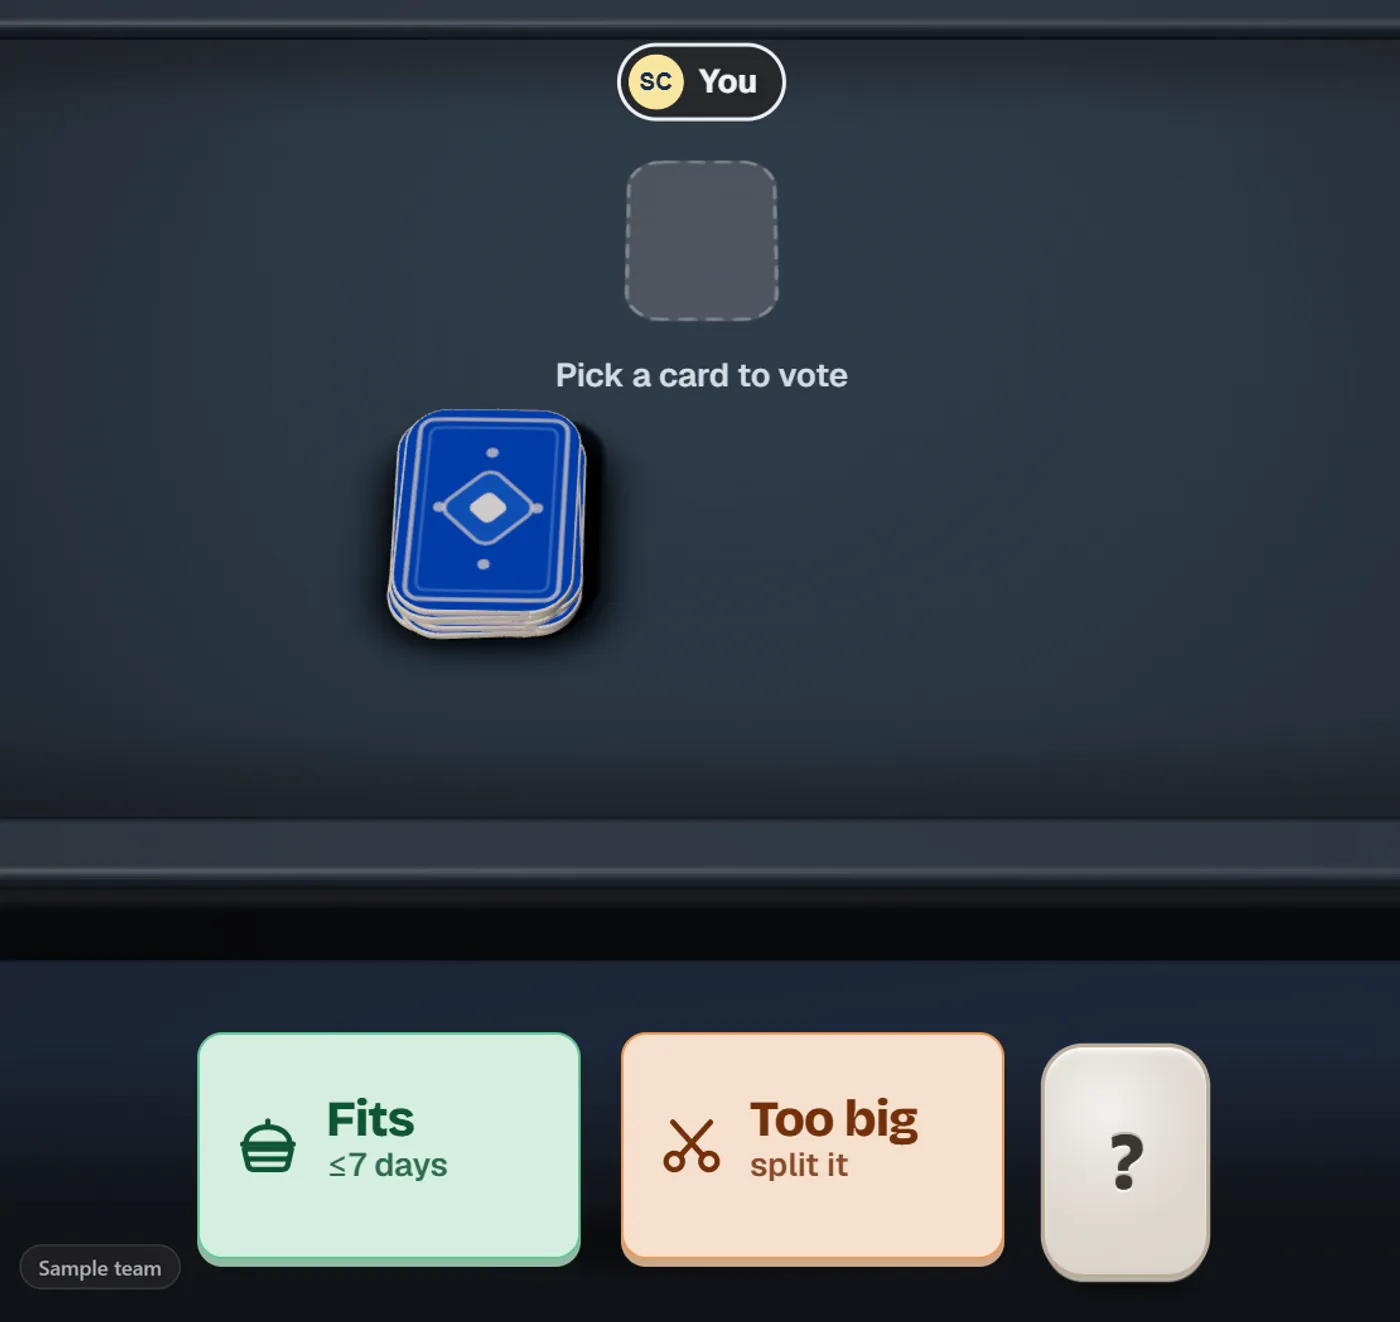
Everyone picks Fits or Too big, and the cards flip together. Sample team, sample data.
Then the room reads the board’s own recent finished work and does the cup-of-slips replay for you. In the example below it replayed the recent weeks many times over and put 100 of those tries on a calendar, one dot per try.
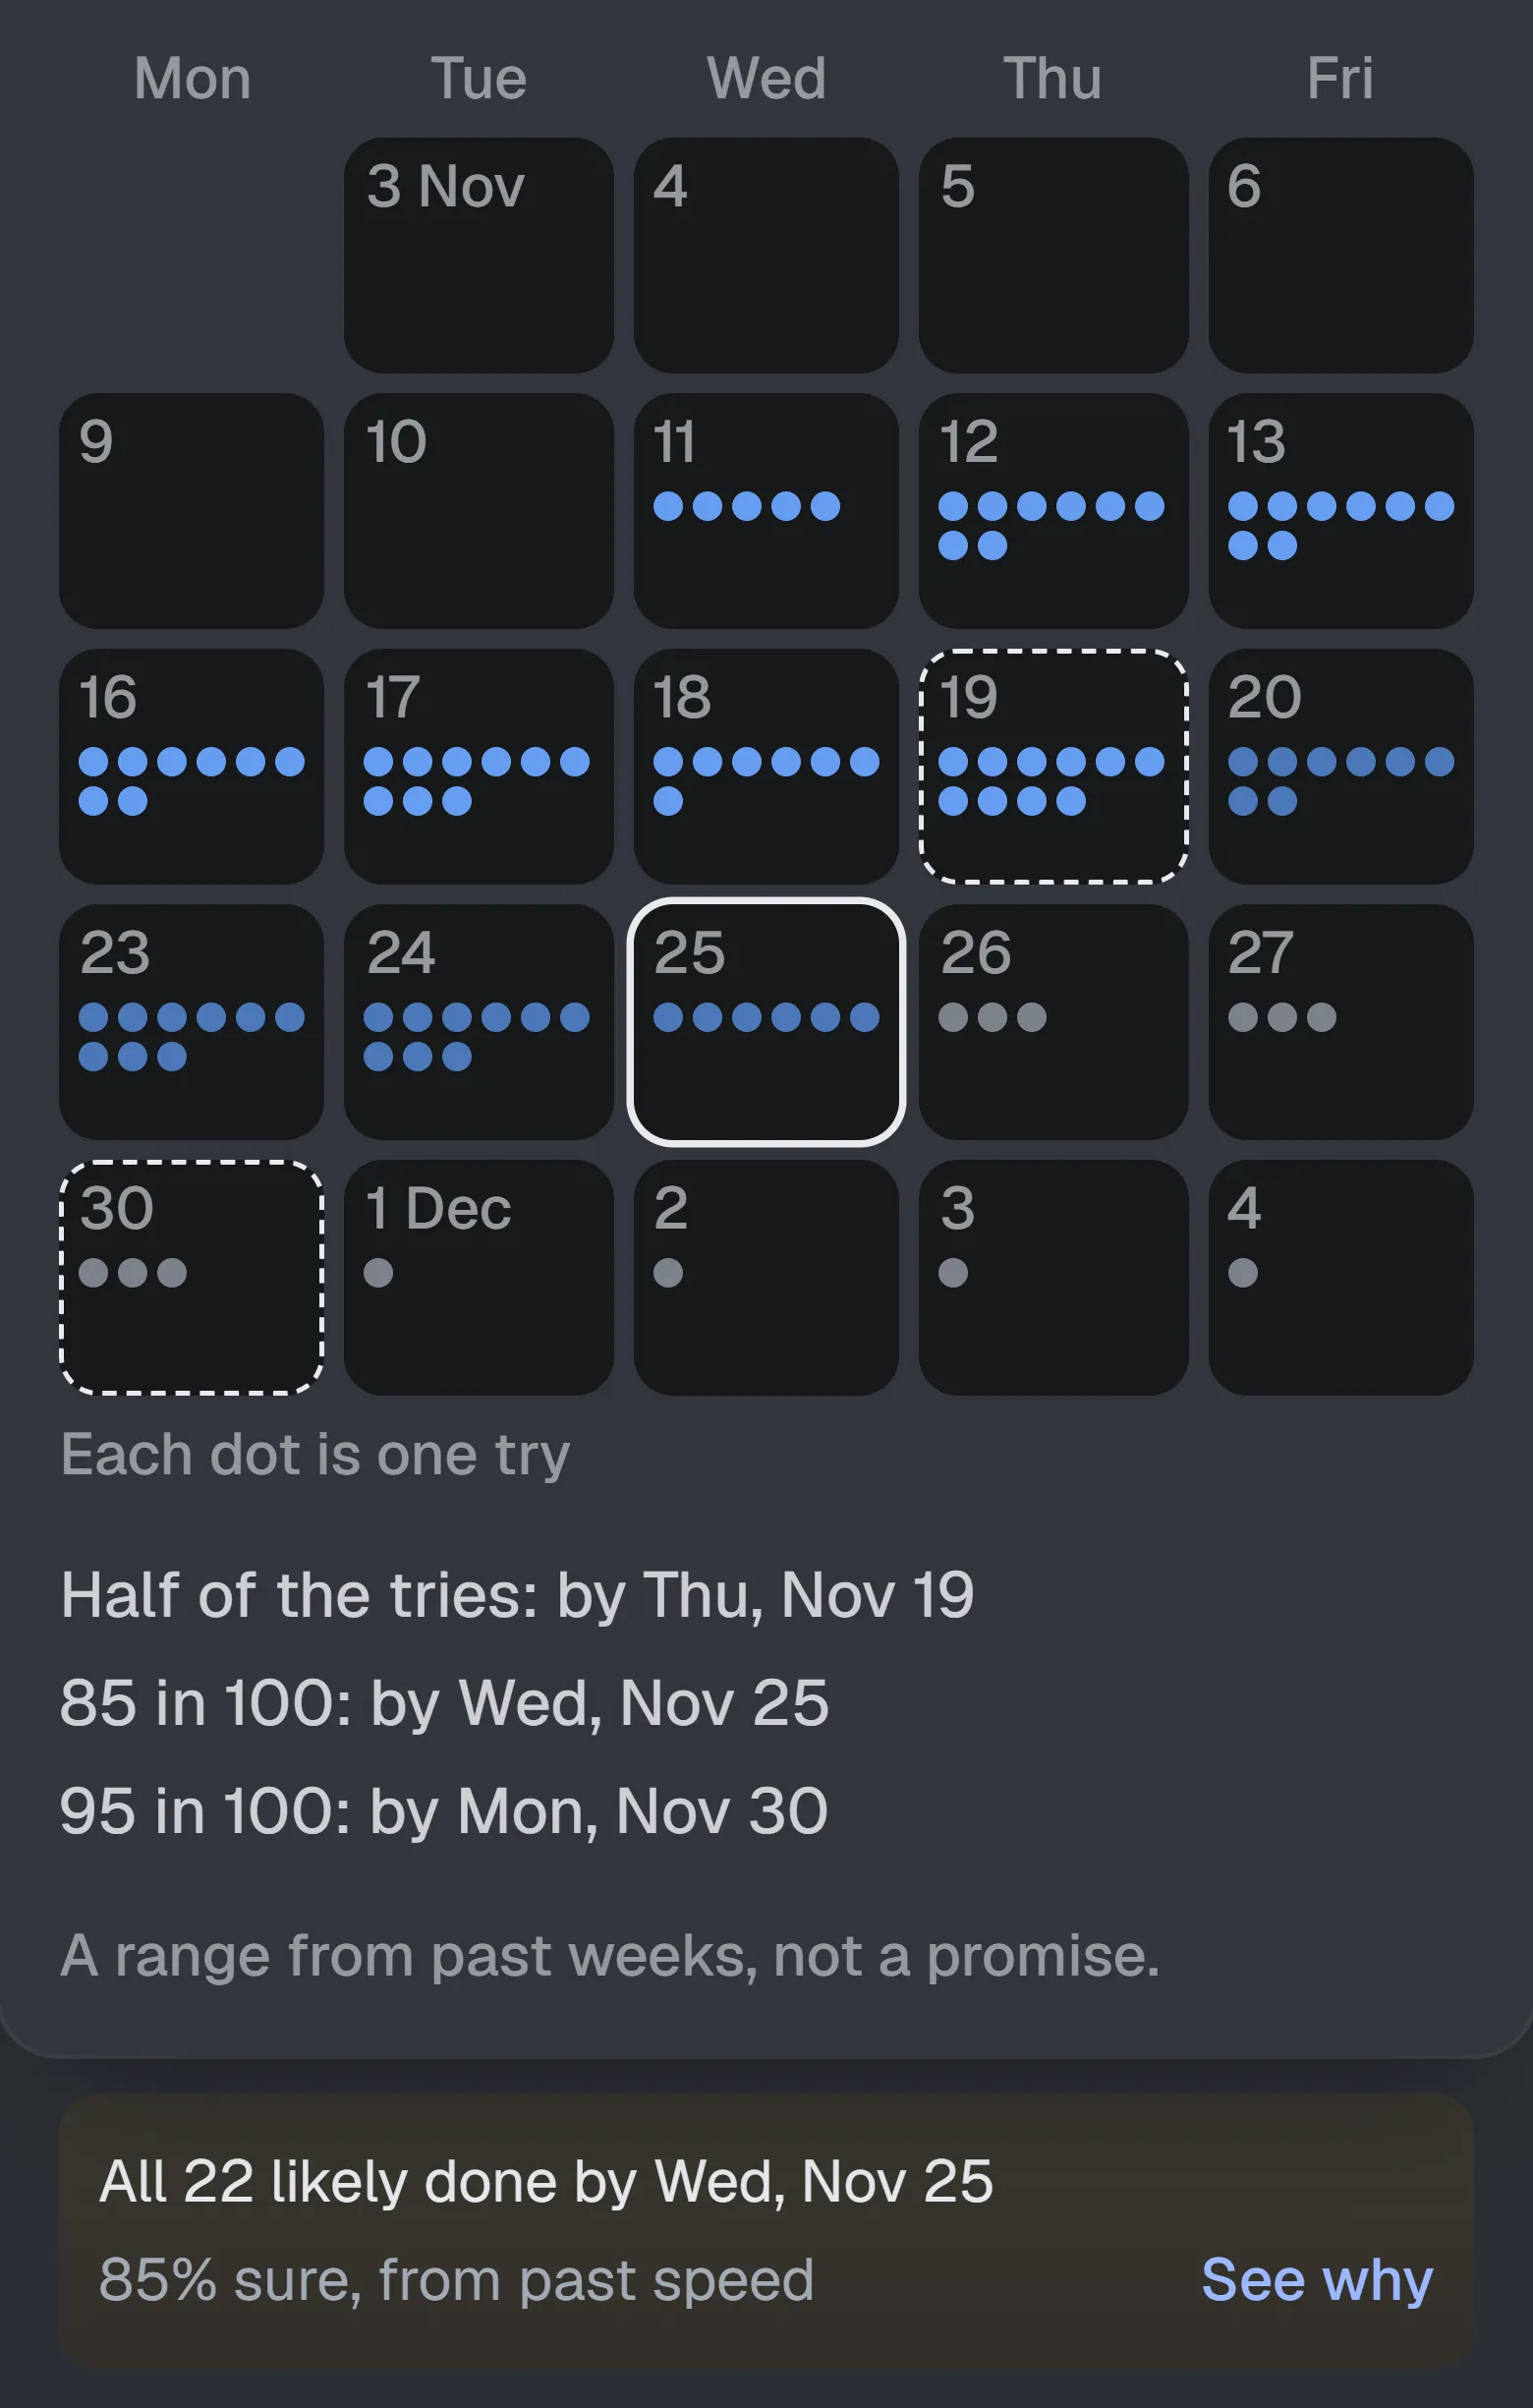
Most tries land in the middle, a few run long. That tail is what a single date hides. Sample data.
A few details worth knowing:
- It gives a likely finish date, never a promise. The room says so on screen.
- A Fits vote stays in the room. Nothing is written to Jira.
- No outside servers, no new login, free for up to 10 users. Jira Cloud only.
If your board is small and nobody wants another tool, the filter and the cup of slips are honestly enough. The app is for teams who would rather vote together than count alone.
A short checklist for your next forecast
- Pick the window: the last four to six weeks.
- Count finished work items per week with a filter. Write the counts down.
- Sort the remaining work items into fits and too big. Split the too-big ones.
- Replay the weeks, or at least try the slowest, average and fastest case.
- Say a range out loud, plus what could move it.
- Redo it next week with one more week of data.
Try it on your own board
See Bunlings, scrum poker and retros inside Jira
Install Bunlings from the Atlassian Marketplace
Prefer to watch first? Watch the demo