
 Bunlings: sprint apps for Jira





Wednesday of sprint planning. The plan has 28 points in it, the team looks tired, and the product owner asks: “will we make it?”
“Probably” is not an answer. “In four of our last ten sprints we finished that much” is. Here is how to get to the second one, by hand, with what Jira already shows you.
What does it mean to forecast a sprint?
It means answering one question with a chance: how likely is it that this plan gets finished by the sprint end date?
You do not need a model for that. You need your past sprints, because they are the only evidence you have of how your team, with its habits, its meetings and its bugs, really finishes work.
How do you do it by hand?
Use the Velocity chart. It lists the completed estimate for each recent sprint. Open it in a company-managed Scrum space under Reports, then Velocity Chart. How to read the Jira velocity chart shows where it is and what to watch for.
- Write down the completed bars for the last ten sprints.
- Total up the plan. The estimate of every work item in the sprint you are about to start.
- Count the sprints where the completed bar reached the plan.
- Say it as a fraction. “Four of the last ten.”
A made-up team, completed points in its last ten sprints: 24, 31, 27, 19, 29, 26, 22, 30, 25, 28. The plan is 28.
| Sprint completed | Reached 28? |
|---|---|
| 31, 29, 30, 28 | Yes (4 sprints) |
| 24, 27, 19, 26, 22, 25 | No (6 sprints) |
Four in ten. That is “too close to call, leaning towards no”. Now the planning conversation changes: instead of defending 28, the team can ask which 3 or 4 points to leave at the bottom of the list.
What is wrong with the by-hand version?
Three things, and they matter.
- The completed bar includes work that joined mid-sprint. A sprint that completed 31 may have planned 25 and taken in 6. Comparing a 28-point plan with that 31 is a bit unfair. Added and removed work mid-sprint covers that.
- It compares whole sprints. It ignores that this sprint has two people away on Thursday and Friday.
- It says nothing about which items. A 28-point plan with the risky work at the top is a different sprint than one with it at the bottom.
None of that means “do not bother”. The by-hand version still beats a gut feeling. It just has edges.
What does a better forecast look like?
It takes each past sprint’s real pace, plays it forward on this sprint’s work, day by day, and sees which would have finished in time. That is the idea behind a simulation, but in this case the “random” input is your actual history. No made-up curve.
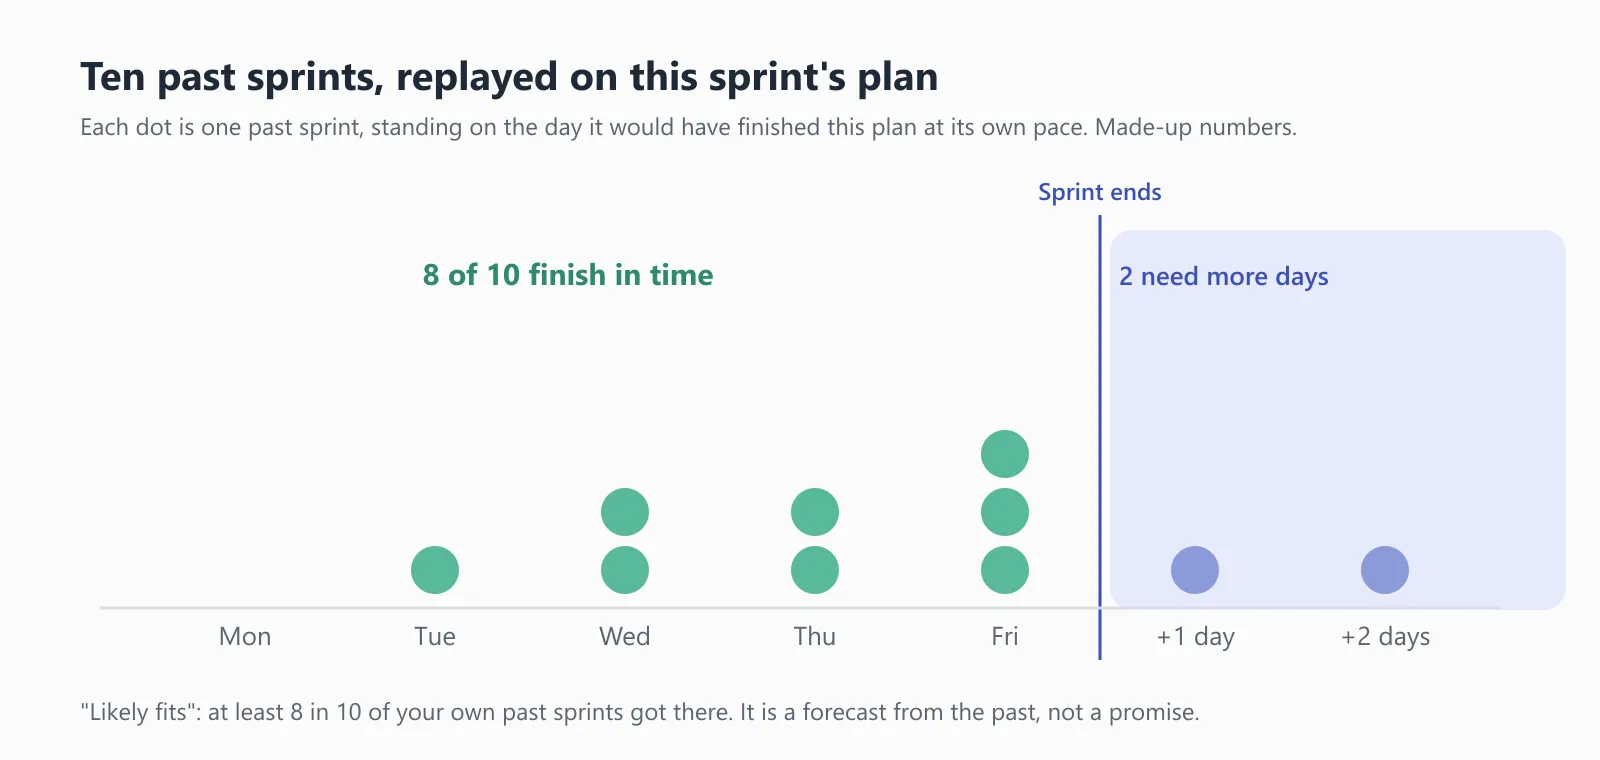
An illustration with made-up numbers. Each dot is one past sprint, standing on the day it would have finished this plan.
You get a count (“eight of ten”) and a spread (“the other two needed one or two more days”). The spread is the useful bit: it tells you whether “no” means “a day late” or “a week late”.
How does Bunlings Sprint Forecast do this?
Bunlings Sprint Forecast is a Jira app that does this replay for you. Open a sprint’s menu in Jira and choose Will this sprint fit? The first time, it reads your last sprints, which takes a few seconds on a normal board.
You get one plain sentence on top: “Likely fits”, “Too close to call”, or “Likely needs about 3 more days”. Under it is the proof: how many of your last ten sprints went fast enough to finish this plan by the sprint end.
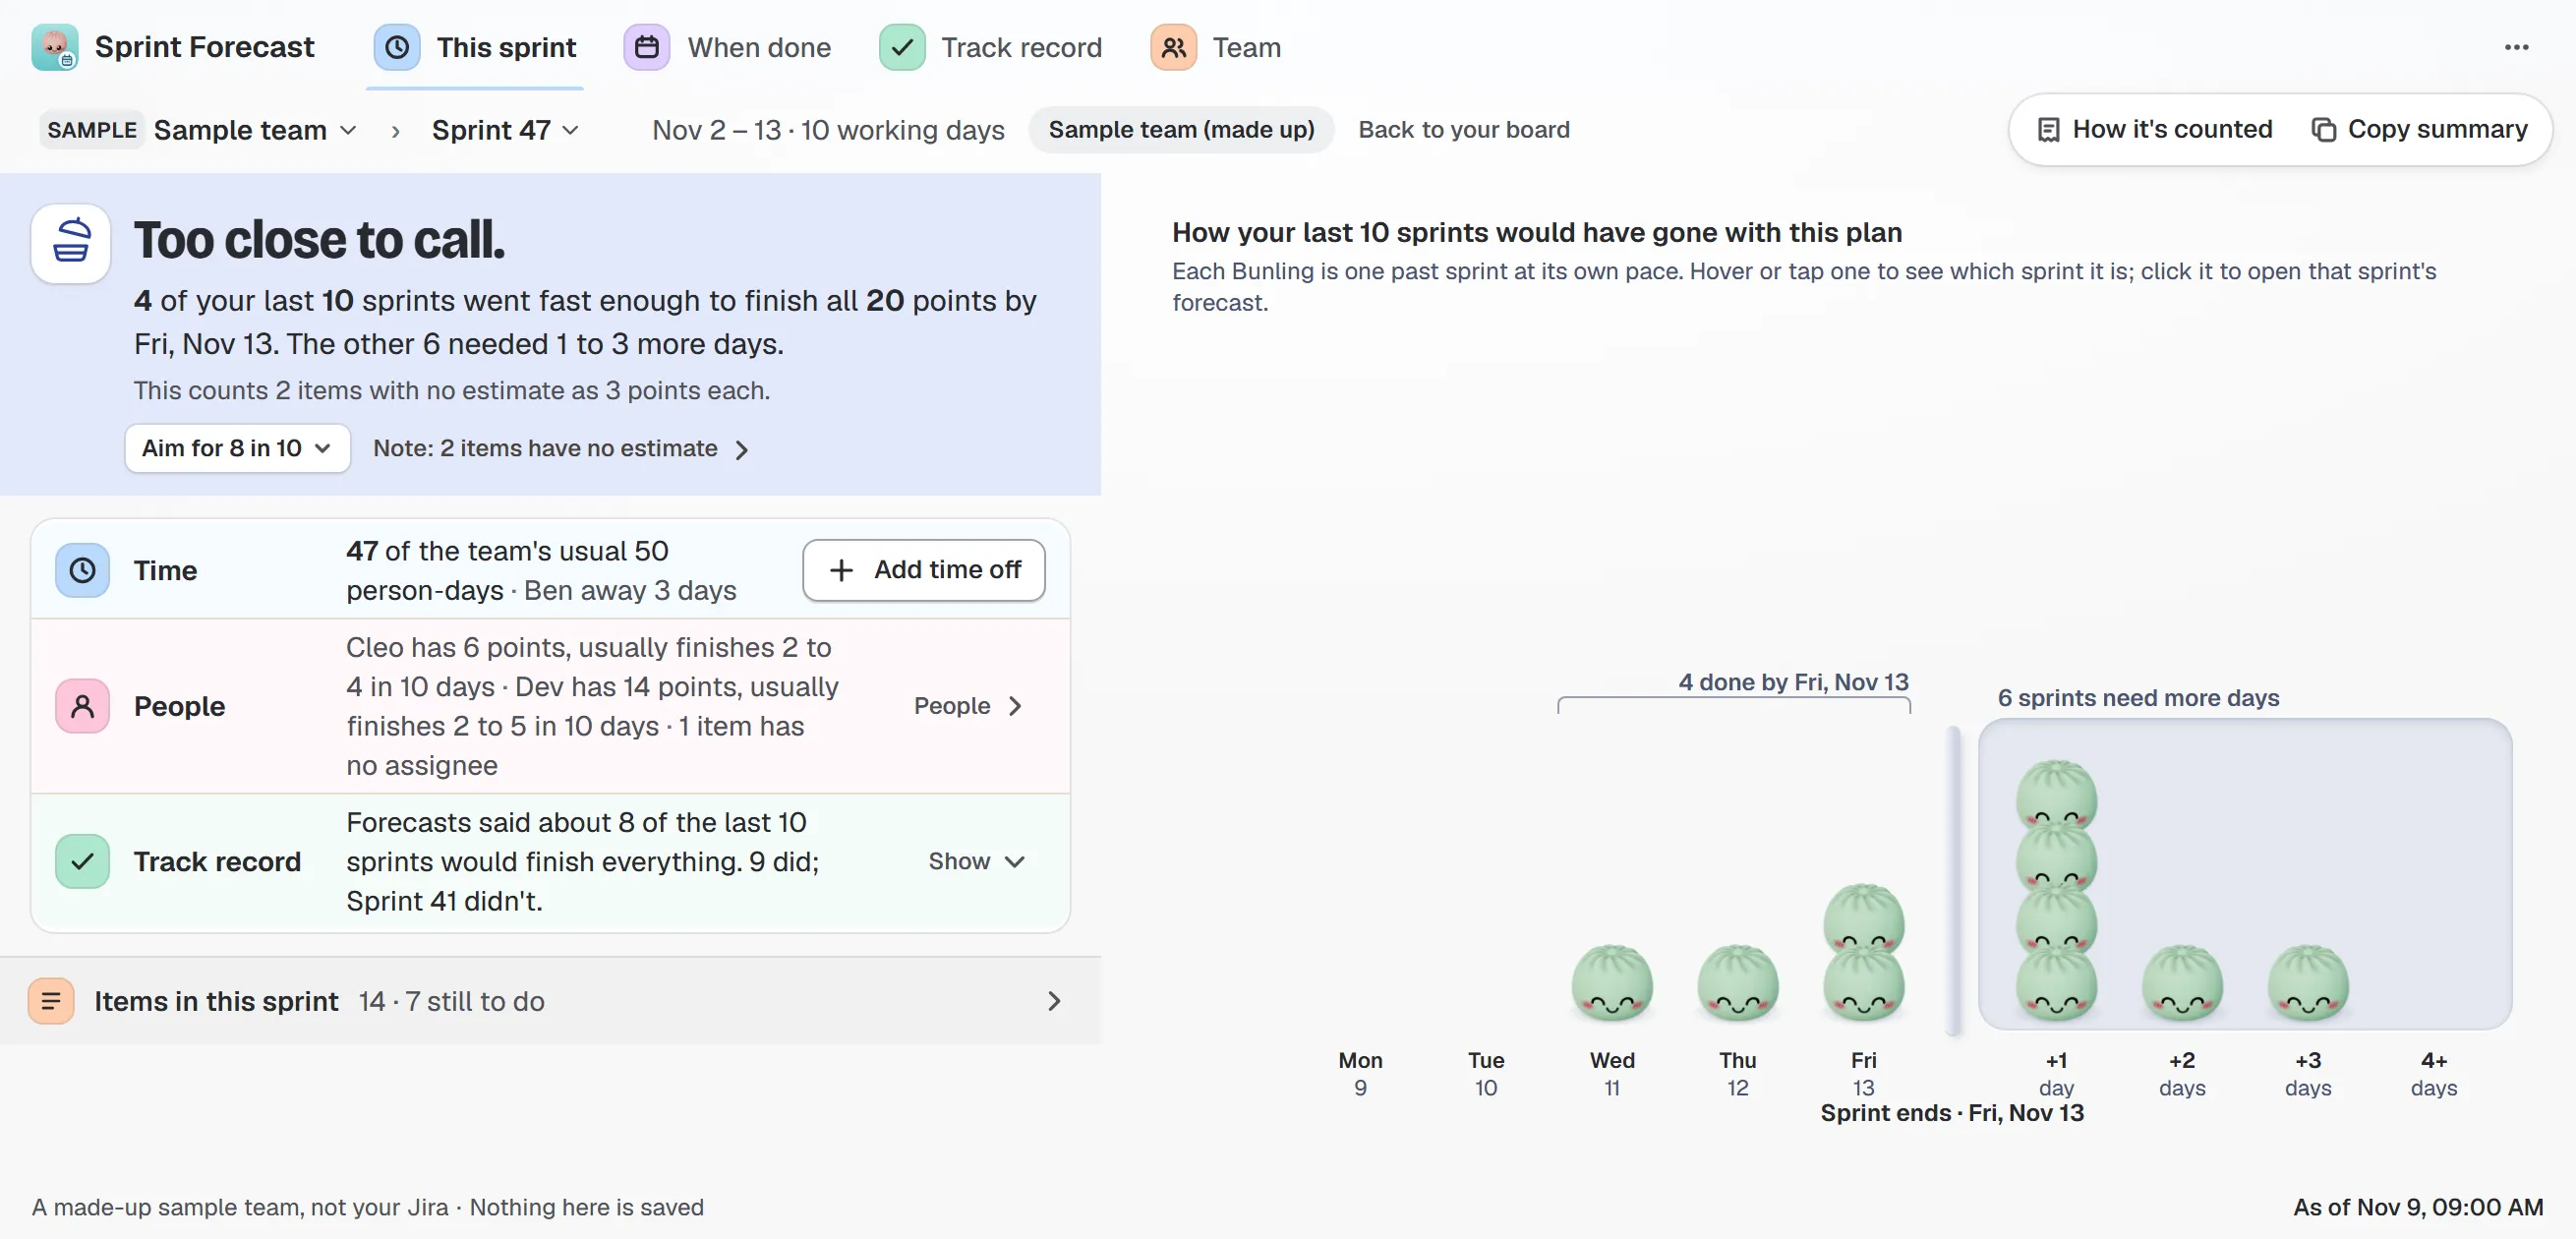
Sample team and sample data. Each little Bunling is one past sprint; the ones on the right need more days.
A few things you can do on that screen:
- Drag the cut line in the list of work items to see which ones stay very likely, and which are a stretch.
- Try adding a backlog item and watch the chance change.
- Change the aim. “Normal” is 6 in 10, “It matters” is 8 in 10, “Release on the line” is 9 in 10.
- Open any number to see the work items behind it, and what was left out.
Time off matters too: holidays and marked away days come off the team’s working days, and each person is compared only with their own usual range, never with each other. Nothing you try is saved in Jira, because the app only reads.
Does it keep score?
Yes. Track record lists what it said for each past sprint and what happened, for example “Forecasts said about 8 of the last 10 sprints would finish everything. 9 did.” If the team changed and it was too hopeful, it says so.
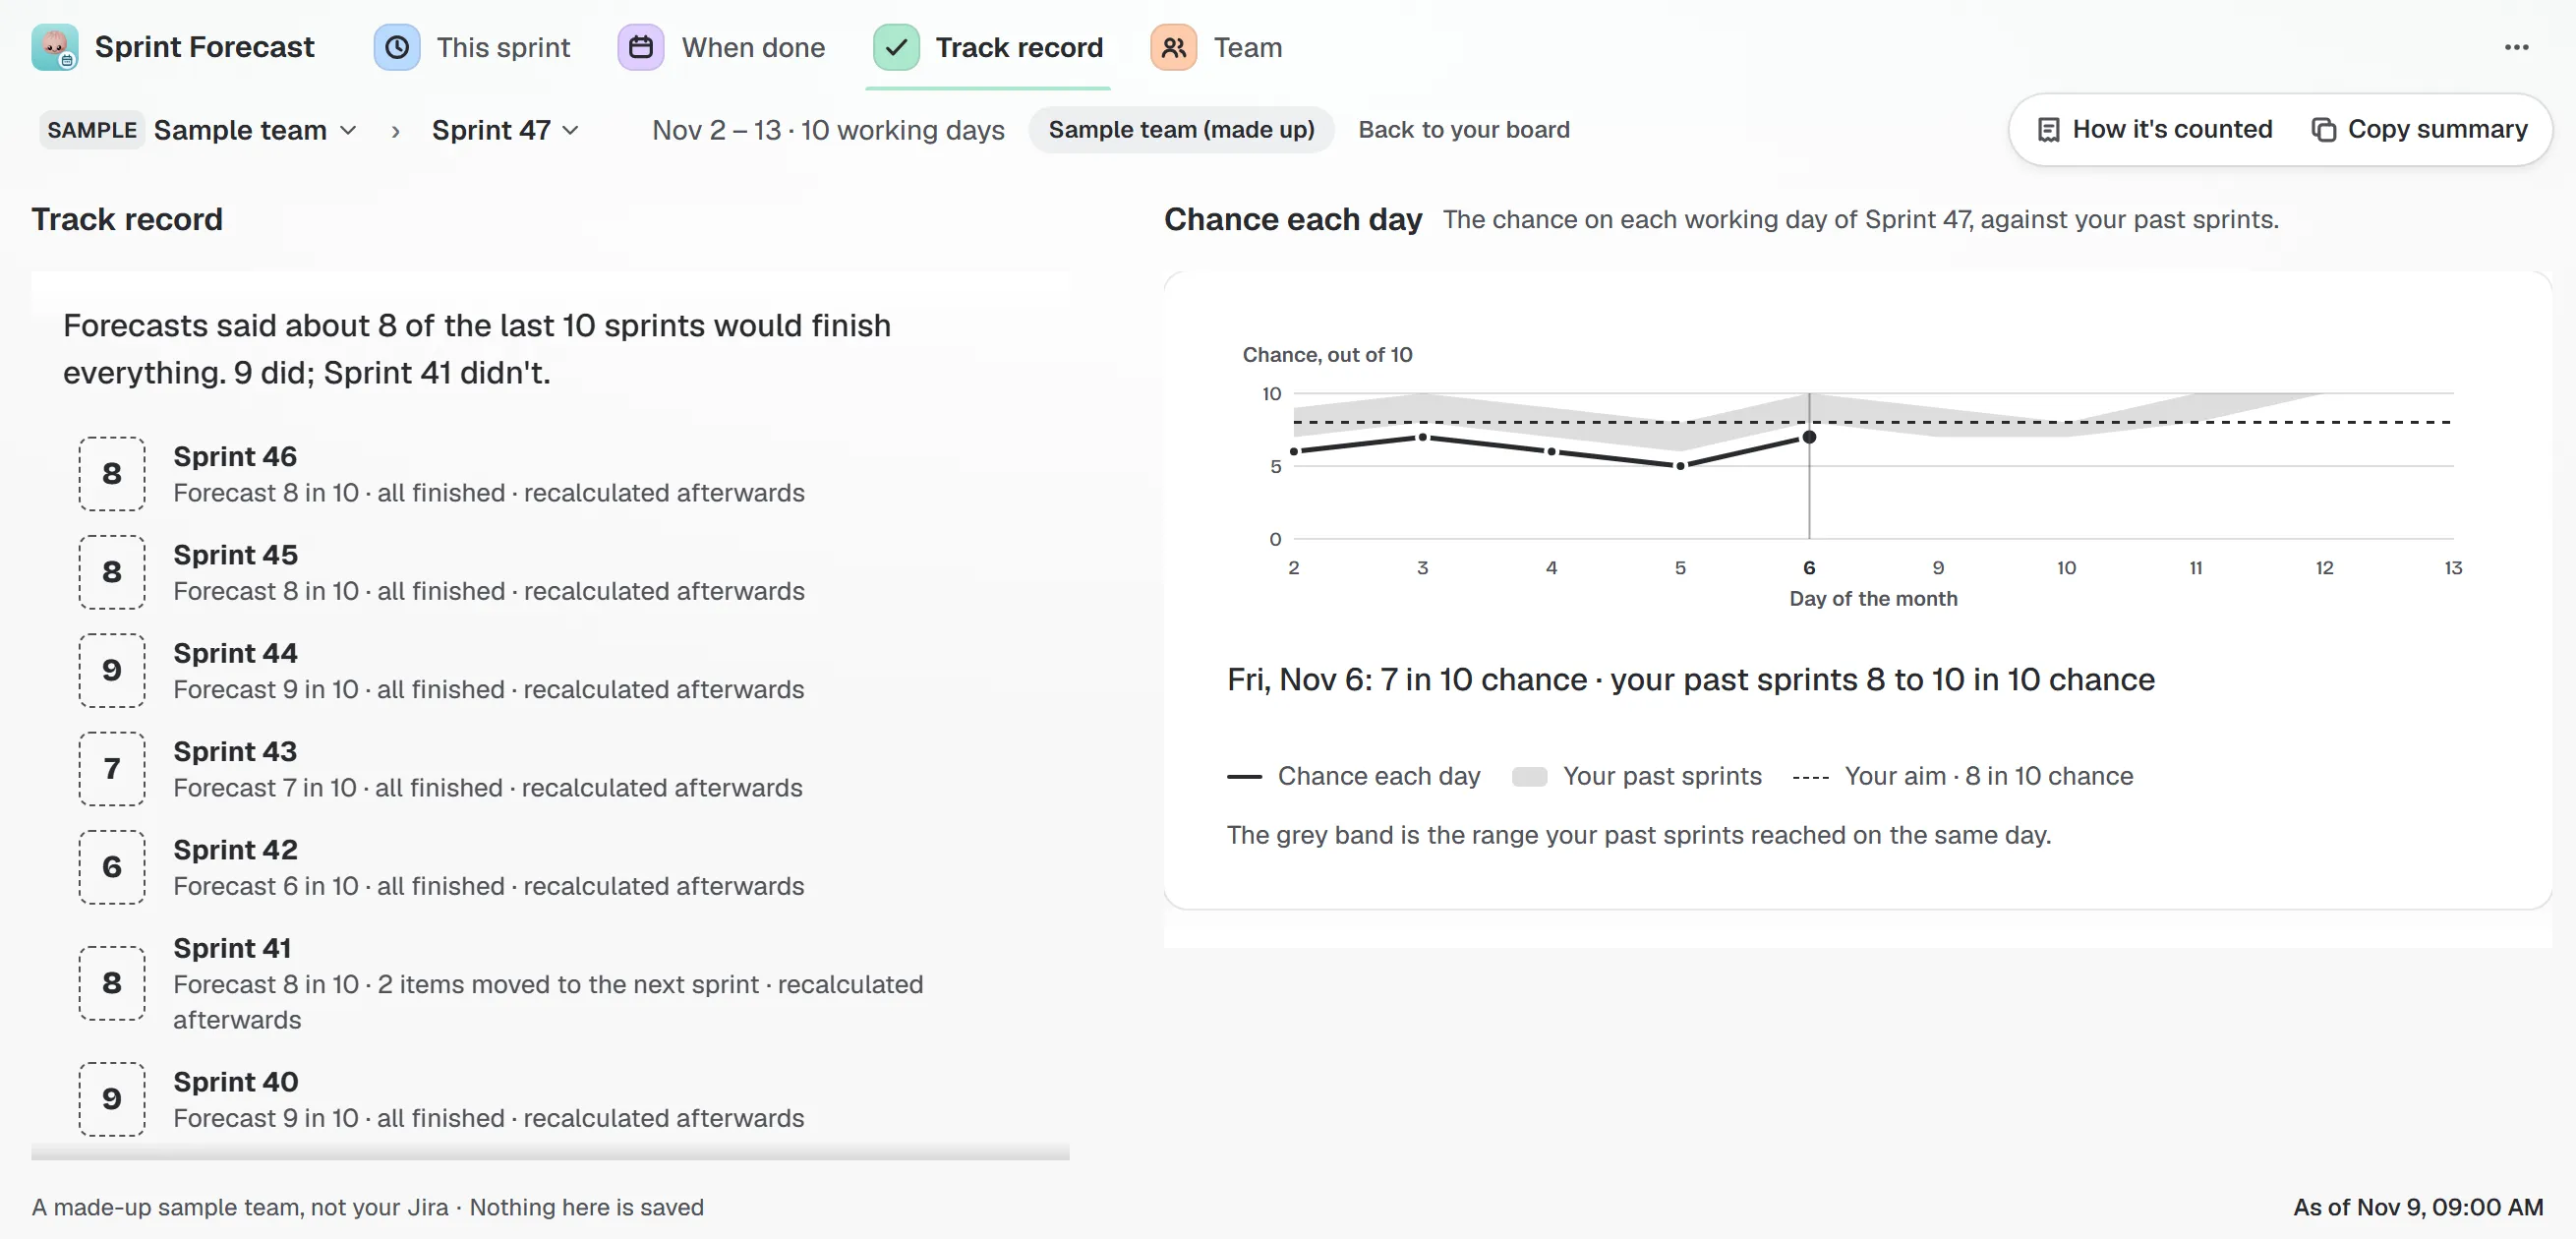
Sample team and sample data. A forecast that keeps score is easier to trust, and easier to correct.
How much to trust the odds is a fair question. Being 85% sure: how confident forecasts work gives the plain-words answer, with the test results and their limits.
When is a forecast not enough?
When something changes after the forecast. A person leaves, production catches fire, a big work item joins on day 3. The forecast is a number from the past, not a promise, and every screen says so. Check it again when the sprint changes. The guide to reading the answer lists every line on the page.
Try it
Sprint Forecast runs inside Jira Cloud and has a free edition for one board.