
 Bunlings: sprint apps for Jira





Day 3 of the sprint. A “quick one” arrives from support, 8 points, and gets dragged into the sprint. By Friday the team finished everything it had room for, including the quick one.
Then the velocity chart goes up, and everyone feels good about a sprint where part of the plan quietly did not happen.
Work that joins or leaves a sprint after it starts is normal. It is also the biggest reason sprint numbers do not mean what they seem to. Here is what it does, report by report.
What does Jira do with work added after the sprint starts?
Three reports, three behaviours. They are described in Atlassian’s pages on the velocity chart and the sprint report.
| Report | What it does with added work |
|---|---|
| Velocity chart, commitment (grey bar) | Left out. It is the estimate in the sprint at the start |
| Velocity chart, completed (green bar) | Included, if it was completed by the end |
| Burndown (red line) | Steps up when work is added, steps down when work is removed |
| Sprint report list | Marks work added after the start with an asterisk |
The velocity chart’s grey bar also ignores estimate changes made after the start. The sprint report shows them: two values with an arrow, like 3 to 3.5, mean the estimate changed.
This is by design, and it is useful. You just have to know it is happening.
What does it do to your numbers?
Take a made-up sprint. The plan at the start is 30 points. During the sprint, work worth 8 points is added, and 6 planned points do not get finished.
| Number | Value |
|---|---|
| Committed (grey bar) | 30 |
| Finished from the plan | 24 |
| Joined later and finished | 8 |
| Completed (green bar) | 32 |
On the velocity chart, that sprint reads 30 committed and 32 completed: a small win. In truth the team finished 80 percent of its plan and took on 8 points of extra work. Those are different stories, and they point to different retro questions.
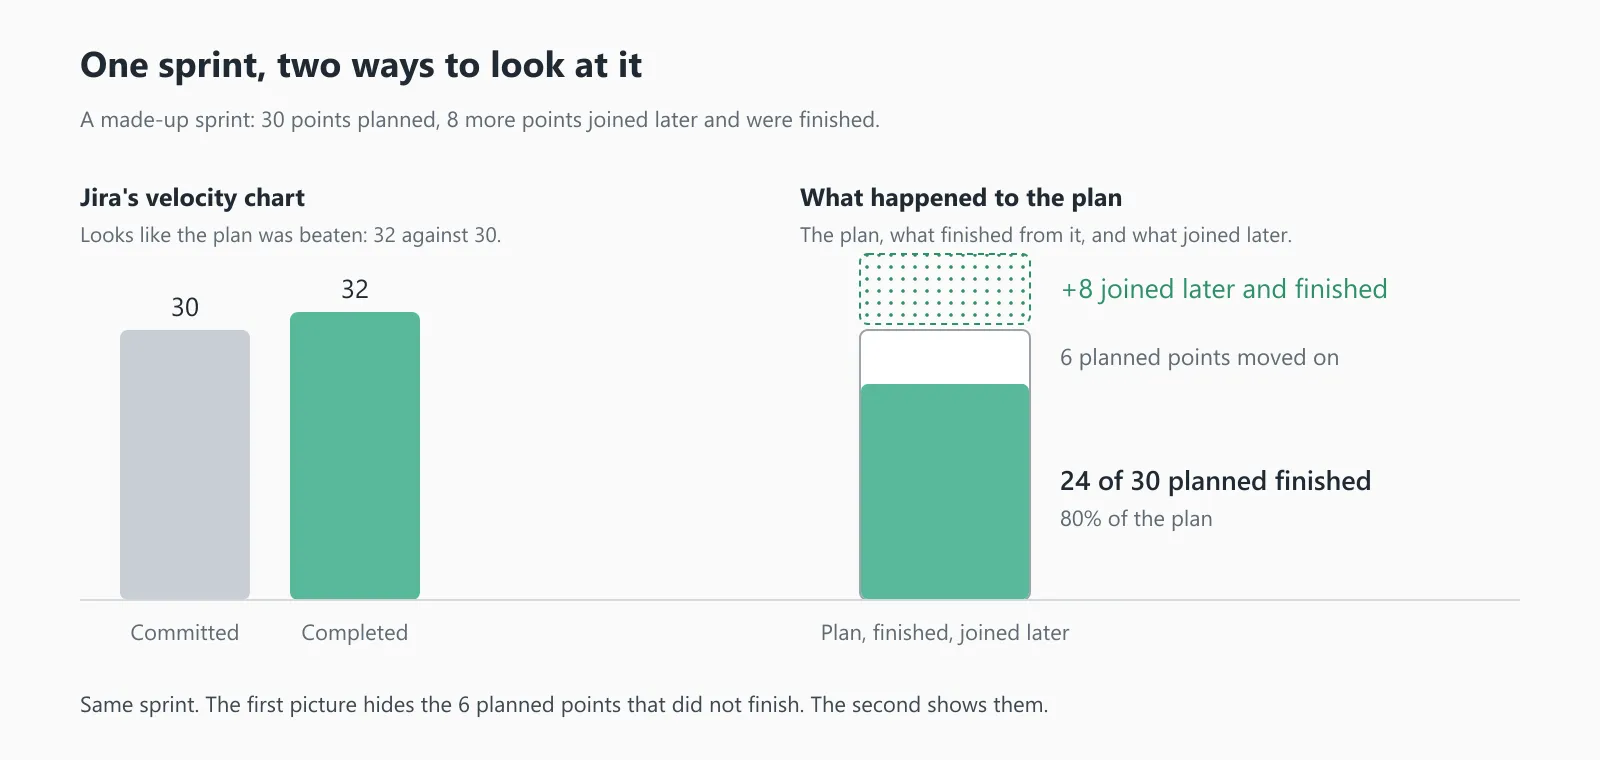
A made-up sprint. The first picture is how the velocity chart reads it; the second separates the plan from the extras.
Over many sprints the effect compounds. A team that takes in work every sprint will show a higher velocity than a team that guards its plan, with the same real output. And a forecast built on that average will be too hopeful about the plan, because the next plan is not going to arrive with its own extras attached.
What about work removed mid-sprint?
The burndown steps down, which can look like progress. It is not: nothing finished, the work just left. Community threads show that totals can also differ between reports when work was removed, so if two numbers disagree, start by asking what was added or removed.
A simple rule: work that was taken out of the sprint was still part of the plan, and the plan did not finish it. A sprint that drops half its work did not have a good sprint.
How do you keep your numbers honest?
Three habits. None needs a new tool.
- Write down the plan at the start. On day one, note the total estimate. Jira’s grey bar does this for you, but the number is easy to miss in the chart.
- Look at the asterisks. In the sprint report, count what was added after the start and what it totalled. Do it in the retro, together.
- Report three numbers, not one. Planned, finished from the plan, joined later. “We finished 24 of 30 planned, plus 8 that joined” is a sentence nobody can misread.
Then compare finished-from-plan with the plan across several sprints. That share is the number to plan with, because it does not depend on how big a point is. Some teams call it the say/do ratio.
How does Bunlings Sprint History handle it?
Bunlings Sprint History is a Jira app that counts the way those three habits do. The plan is the work in the sprint when it started, at the size it had then. Work that joined later sits as a dotted block on top of the jar, so it never makes the plan look bigger. Work that was taken out stays in the plan, so dropping half the work does not look like a win. A work item that grew counts at the size it entered with, and the sprint sheet says “Resized”.
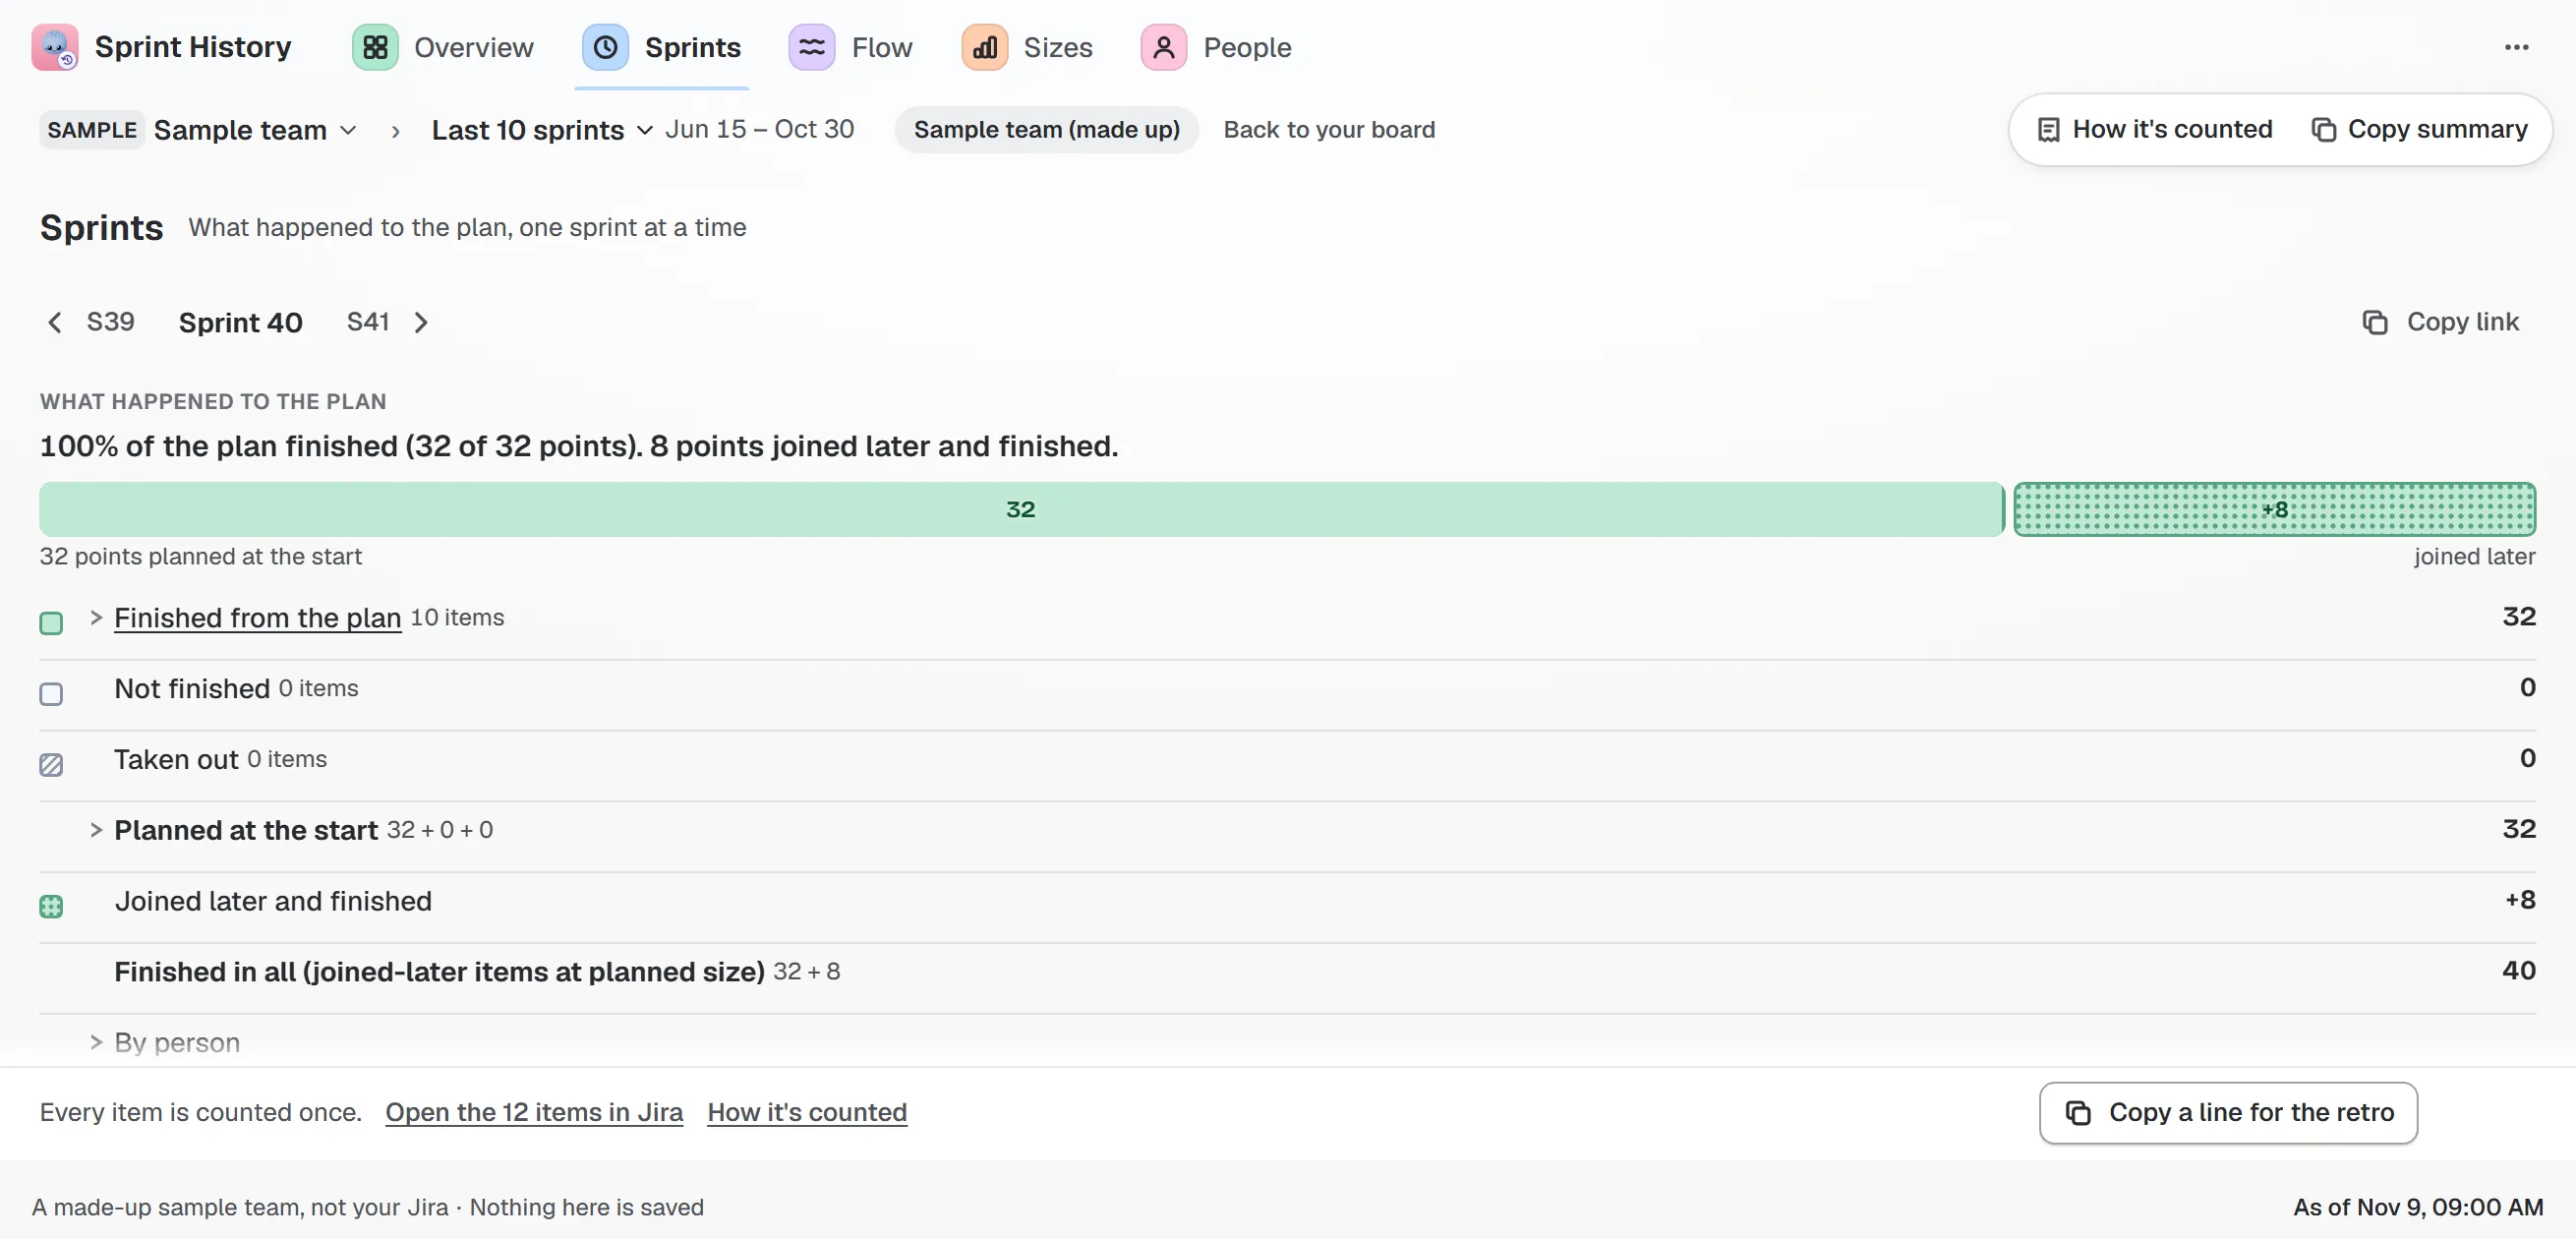
Sample team and sample data. “100% of the plan finished (32 of 32 points). 8 points joined later and finished.”
The headline on the first screen says it as a share: “This team usually finishes 95 to 100% of what it planned, plus about 3 points that join later.” If your team plans for an hour or two after the start, a planning window lets those work items count as planned.
For the running sprint, a burn-up shows the scope as a line that steps up when work joins (“+3 Wed”) and down when work is taken out.
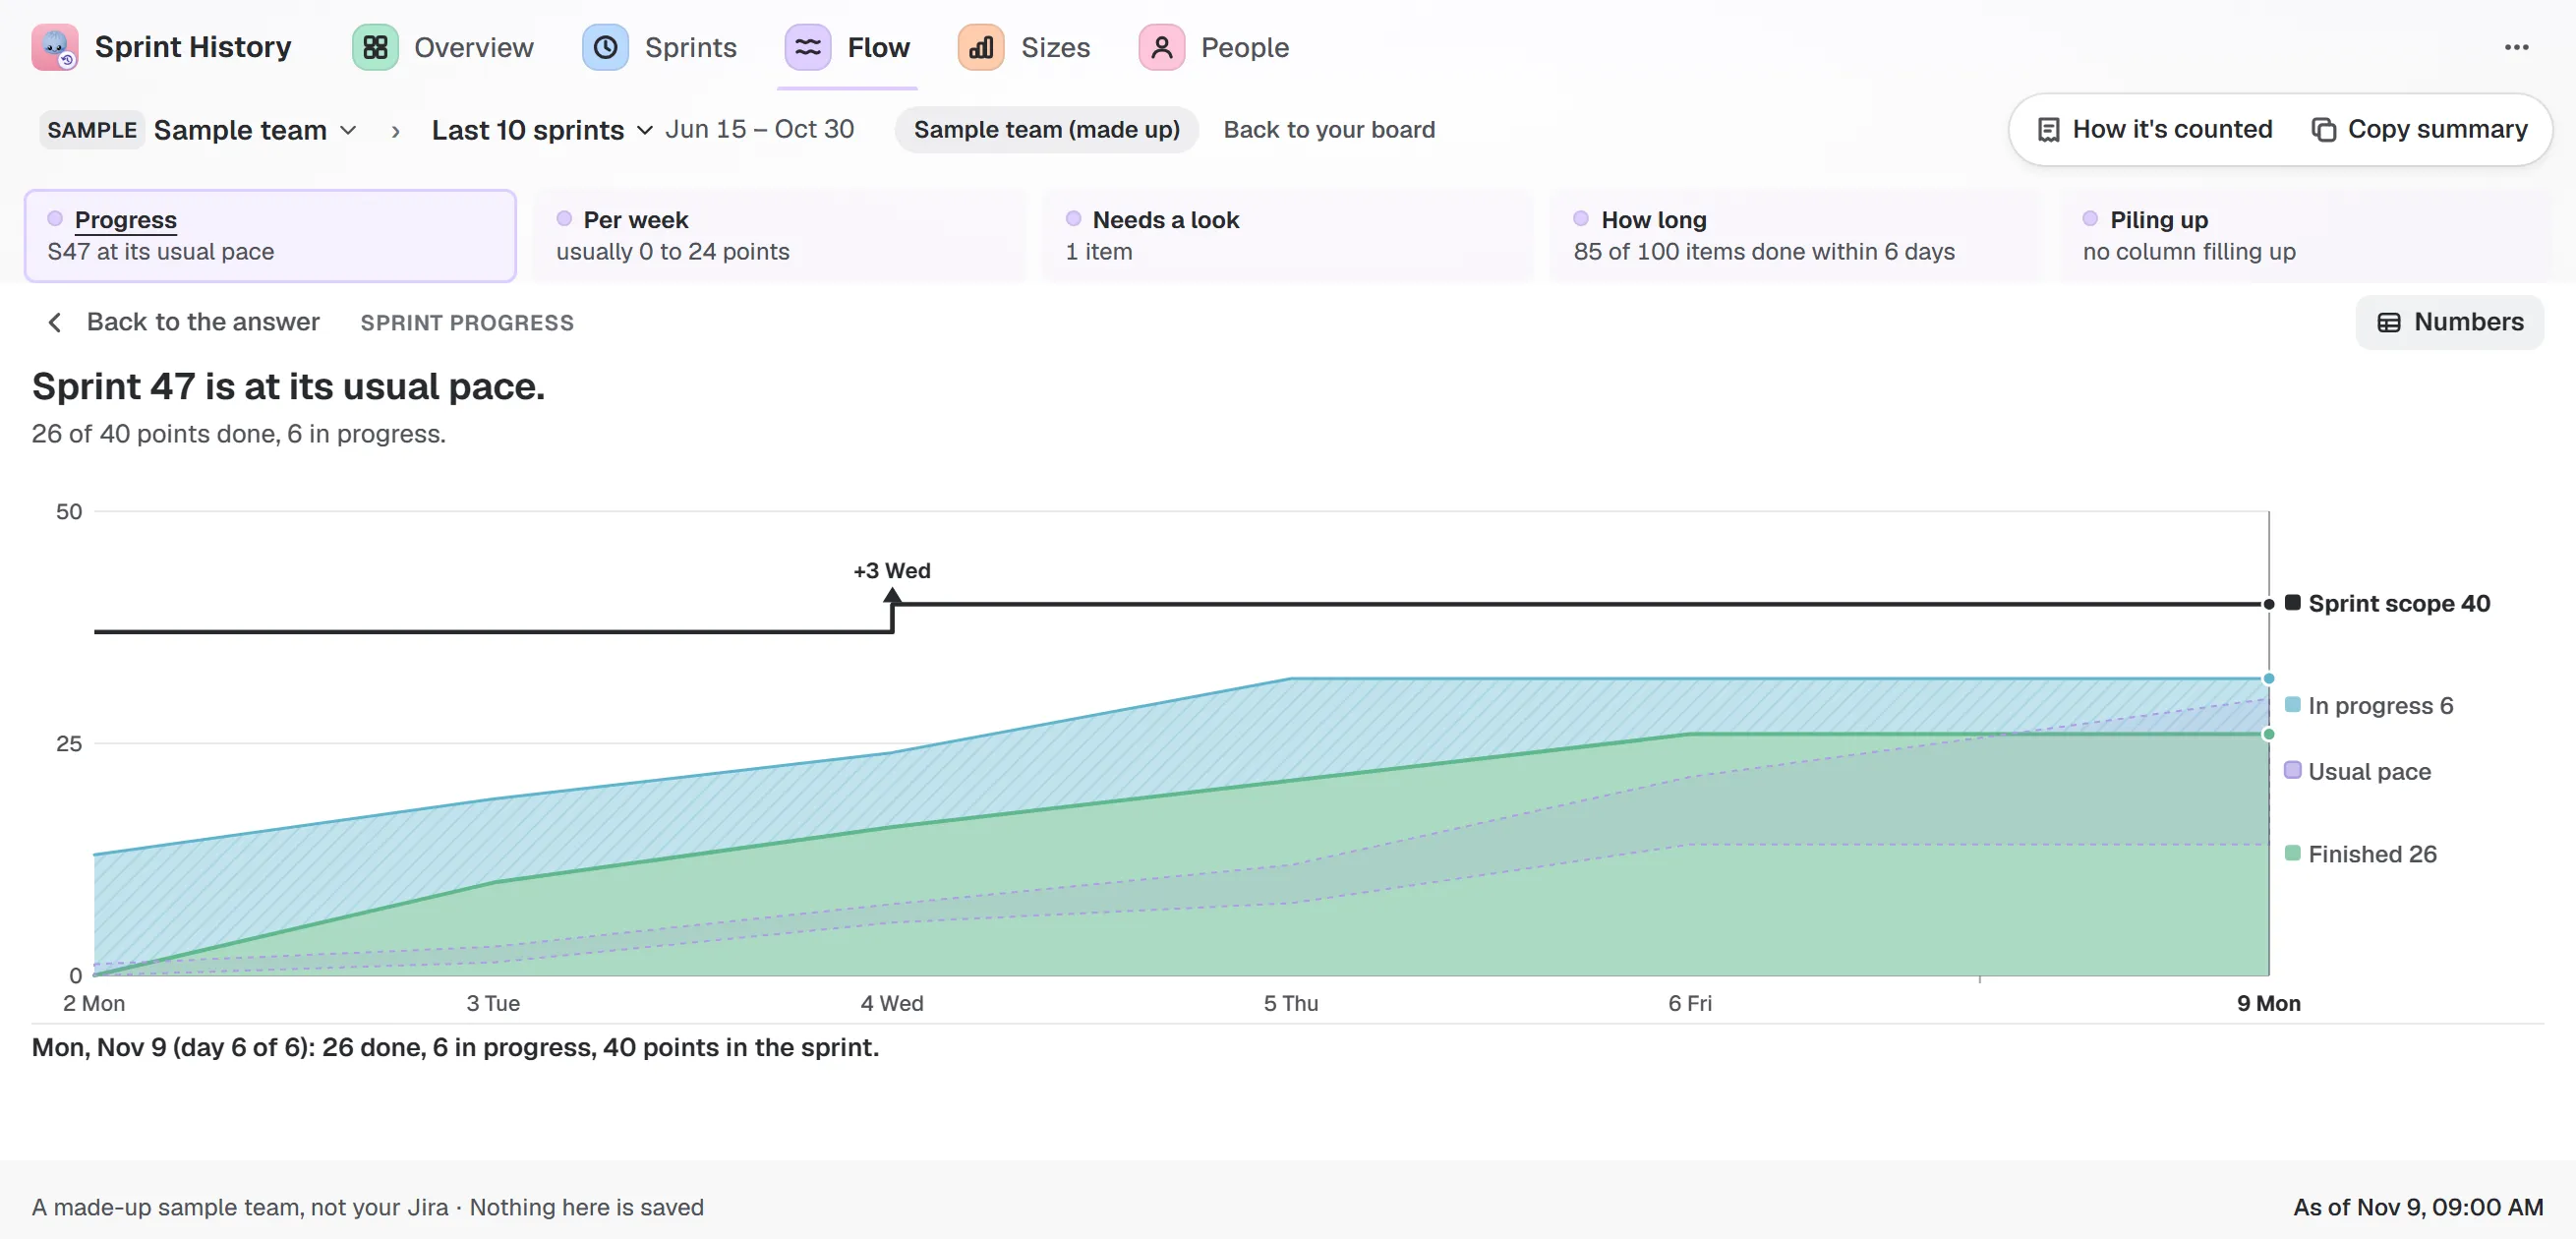
Sample team and sample data. The scope line shows when work joined, so a late jump is not a surprise.
Every number opens the work items behind it, and “How it’s counted” lists the rules. If Jira’s report likely shows another total, a line says why. Read the guide to how it counts for each rule.
Does this affect forecasts too?
Yes. A forecast for a sprint is only as good as its plan. Bunlings Sprint Forecast has a line under the answer that says what changed since you last looked, for example “2 items added (5 points)”, and what that did to the odds. Will we finish the sprint? shows how.