
 Bunlings: sprint apps for Jira





The sprint ended on Friday. On Monday, the retro opens with the sprint report on the screen and one question: “so, how did it go?”
The report has the answer, if you know where to look. Here is what is on the page, what each part means, and what it cannot tell you.
Where is the sprint report in Jira?
In a company-managed Scrum space:
- Open your board.
- Choose Reports in the space navigation.
- Choose Sprint Report.
- Pick a sprint from the dropdown.
It works for Scrum boards in company-managed spaces. Atlassian’s page on the sprint report has the full description.
What does the burndown chart show?
Two lines, sometimes three.
- Grey line (guideline): the ideal path from the total estimate at the start to zero at the end. It stays flat on non-working days.
- Red line (actual): the current total estimate of the work items that are not done. It goes down as work finishes, and it goes up when work is added or an estimate grows.
- Green line: only when the board tracks remaining estimates and time spent. It shows logged work.
A red line that sits above the grey one means the sprint is behind the ideal path. A red line with a step up in the middle means something was added or re-estimated. The chart itself does not say which of the two it was, so open the work item list below.
What does the work item list show?
Under the charts, the work items are listed and grouped by whether they were completed. Two details in the list are easy to miss:
- An asterisk next to a work item means it was added after the sprint started.
- Two values with an arrow, like 3 to 3.5, mean the estimate changed during the sprint.
Both tell you something the chart alone does not: whether the sprint went to plan, or whether the plan moved.
What counts as completed?
A work item is done when its status maps to the board’s right-most column. A work item is “to do” when its status maps to the left-most column. The whole report leans on that mapping, so if a status sits in the wrong column, the report is wrong in a quiet way.
Two more rules from the same page. Only the estimates on parent work items count, so sub-task estimates are left out. And the report shows only work that matches the board’s saved filter.
A worked example
A made-up sprint of 30 points. On day 3, someone adds a work item of 8. On day 7, a 3 becomes a 5. At the end, 24 of the original 30 points are done, plus the 8 that were added.
| What you see | What it means |
|---|---|
| Red line steps up by 8 on day 3 | Work joined the sprint |
| Red line steps up by 2 on day 7 | An estimate grew from 3 to 5 |
| Asterisk next to the 8-point work item | It was not in the plan at the start |
| 3 to 5 next to a work item | Its estimate changed in the sprint |
| 32 completed in all | 24 from the plan, 8 that joined later |
Read quickly, the sprint finished 32. Read properly, the team finished 24 of 30 planned points and took in 8 more. Both are true, and they lead to different retro conversations. Added and removed work mid-sprint goes further into why.
What is the sprint report good for?
Three things it does well:
- A single sprint’s story. What was in it, what finished, what moved.
- Spotting scope changes. The asterisks and the red line steps.
- A shared starting point for a retro. Everyone looks at the same facts. The sprint retro guide shows one way to run it.
What can’t the sprint report tell you?
It shows one sprint at a time, so it cannot say whether this sprint was a normal one. For that you compare it with the others, which is what the velocity chart is for. It does not say what a work item’s size meant in days. And it does not forecast anything: it is a record of the past.
How does Bunlings Sprint History relate to the sprint report?
Bunlings Sprint History is a Jira app that reads the same sprints and tells the same story from another angle. It is read-only and does not replace Jira’s report.
Open a sprint in it and you see what happened to the plan: planned at the start, finished from the plan, joined later, taken out. Every line opens the work items behind it, and one button copies a line for the retro. If Jira’s report likely shows a different total, a “Worth a look” line says by how much and lists each step.
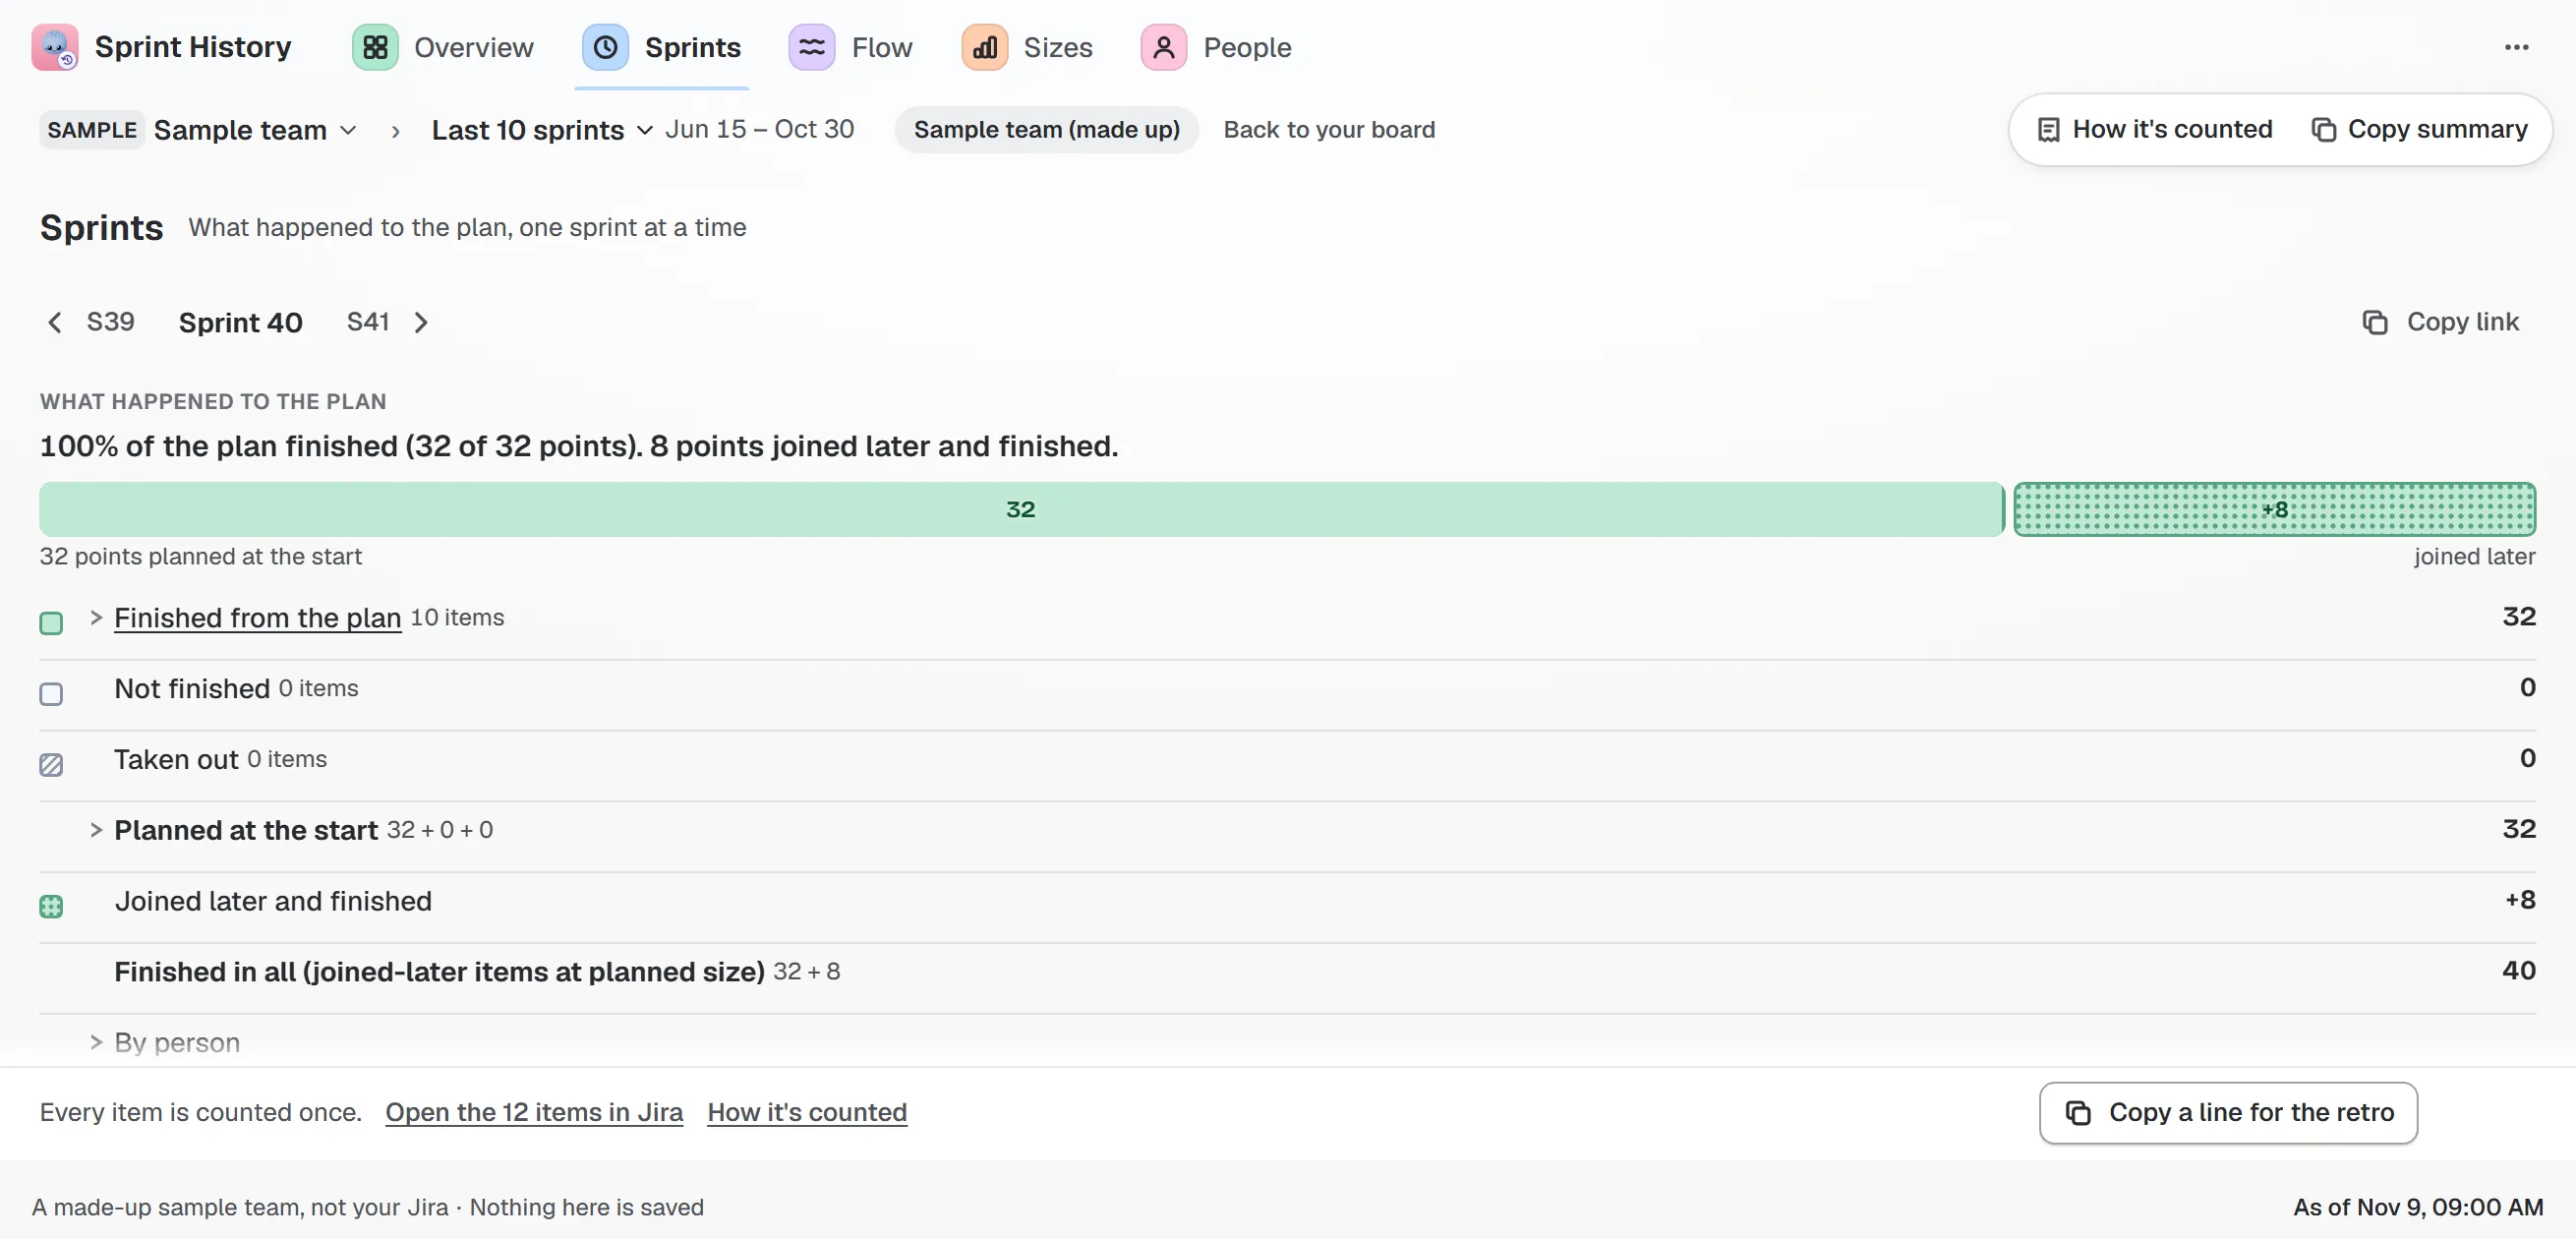
Sample team and sample data. Planned at the start, finished from the plan, joined later, taken out: each line opens its work items.
The Flow tab has a burn-up for the running sprint, day by day, with a band showing the usual pace from past sprints. A step in the scope line is labelled with what joined and when.
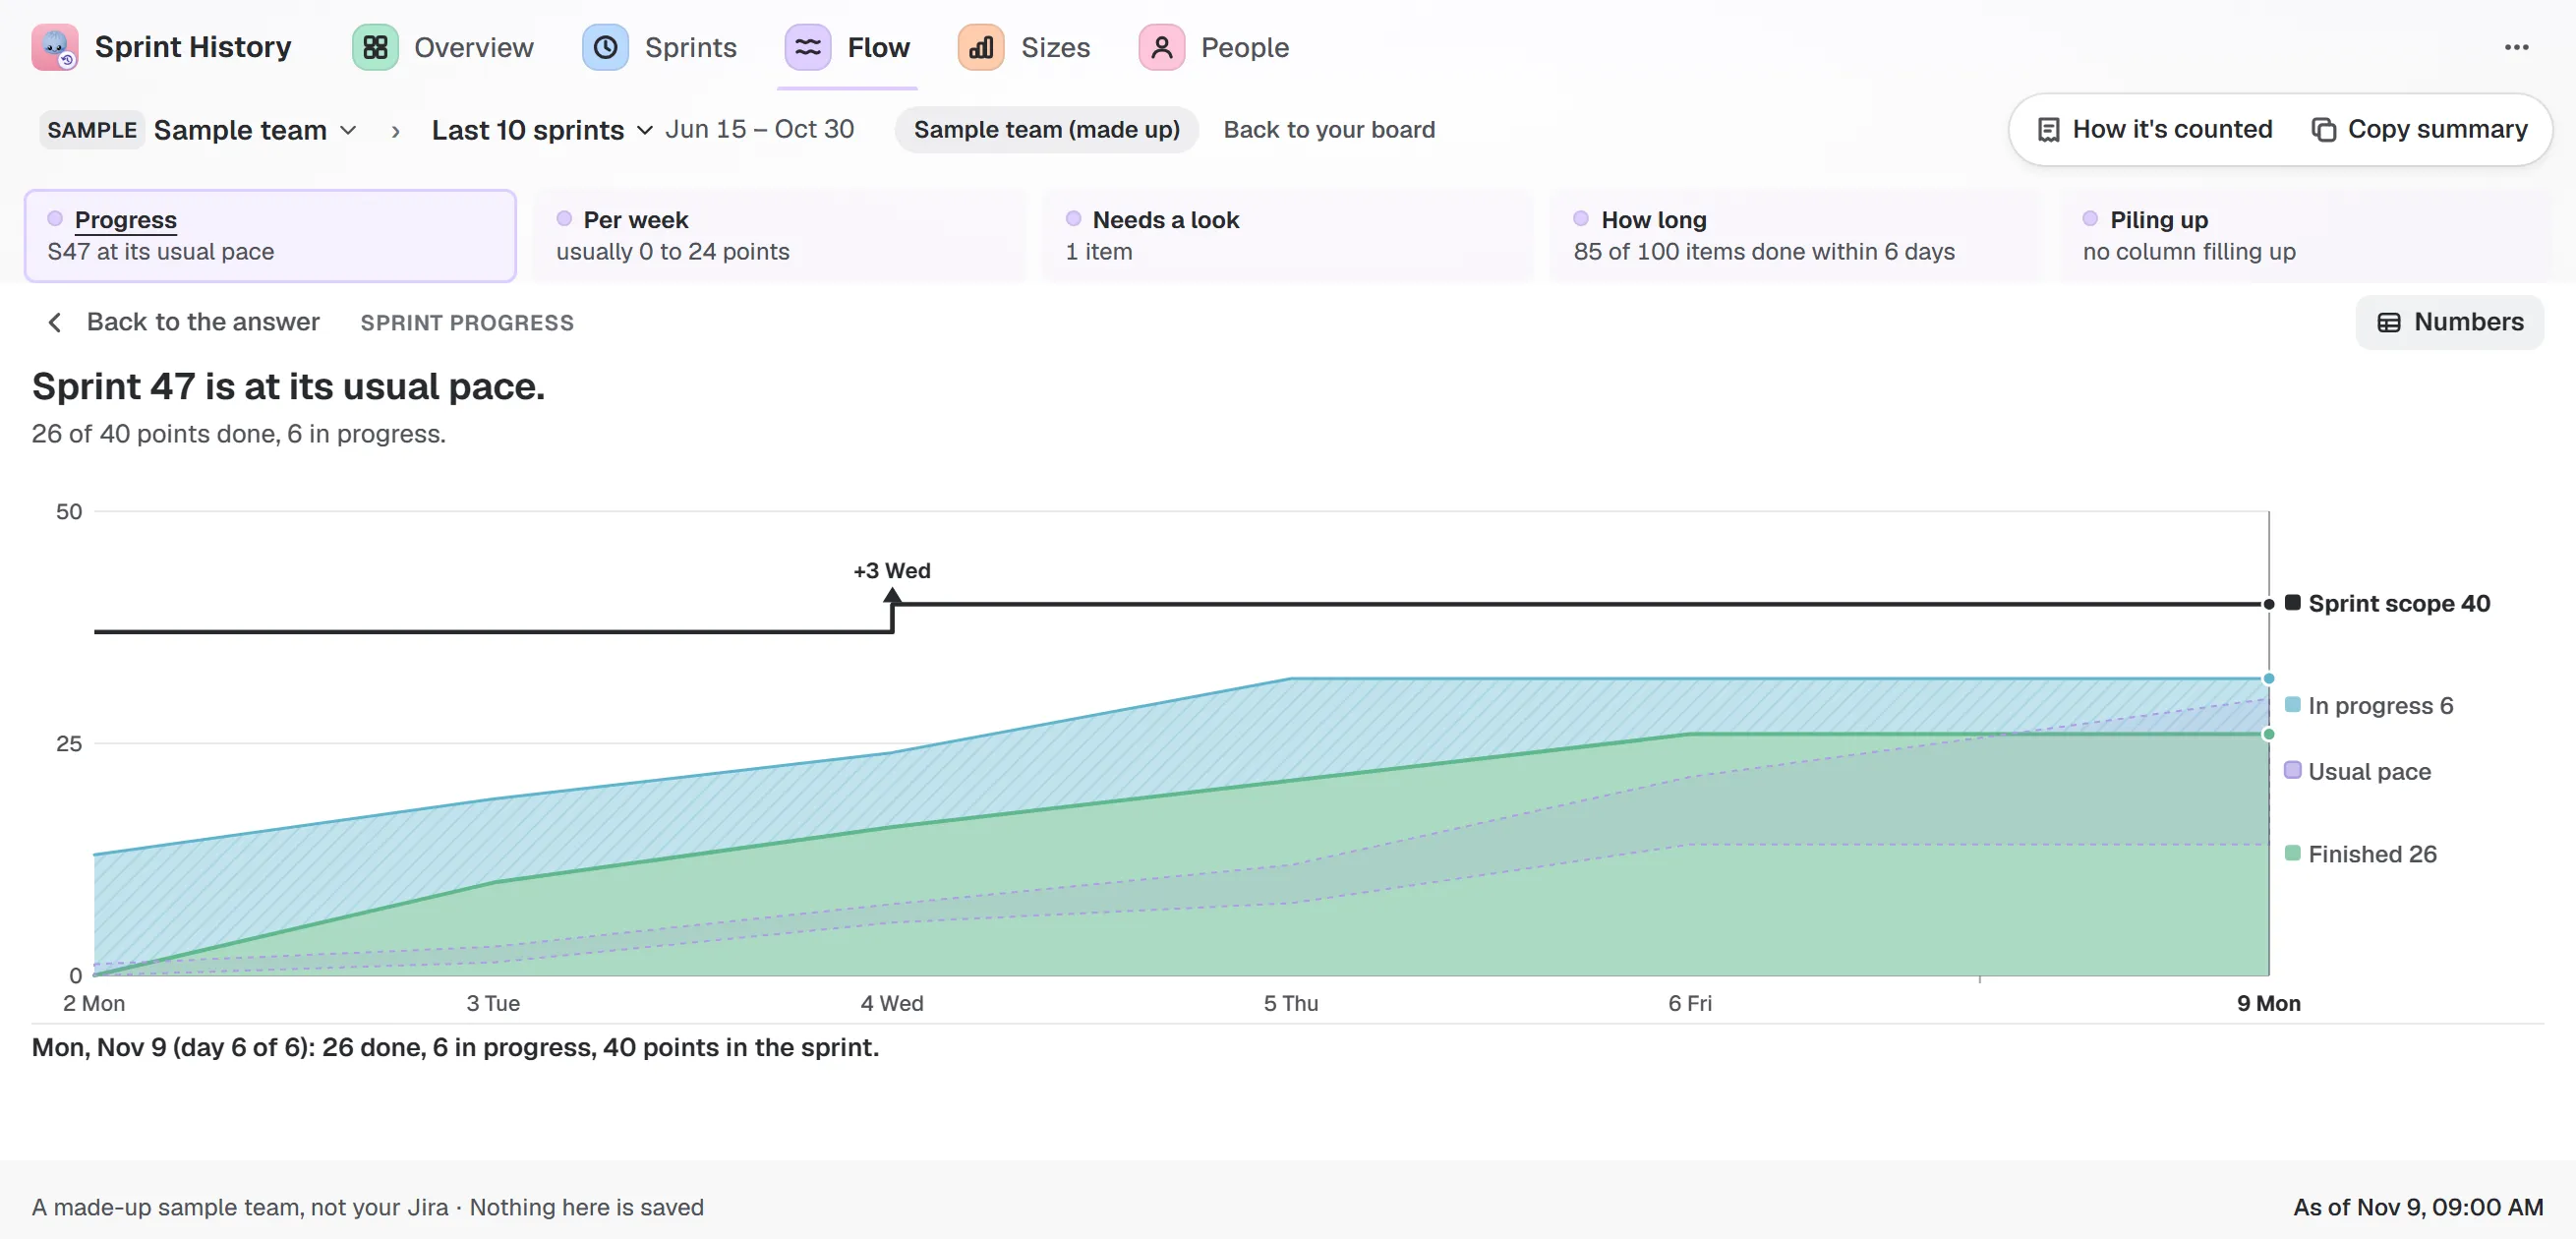
Sample team and sample data. “Sprint 47 is at its usual pace.” The scope line steps up when work joins.
The guide to how it counts lists every rule, so you can see where it differs from Jira’s.