
 Bunlings: sprint apps for Jira





Jira already ships the reports most teams use to look back at a sprint. Whether you need anything on top of them depends on the questions you get asked, not on how many charts you have.
Here is what Jira does on its own, what Bunlings Sprint History and Bunlings Sprint Forecast add, and when the built-in reports are the right call.
How this comparison was made. Jira behaviour comes from Atlassian’s documentation for the velocity chart, the sprint report, the epic burndown and the release burndown, read on 9 November 2026, plus Atlassian Community threads about how the reports differ. Bunlings behaviour comes from the current apps. It compares what each does and makes no promise about better forecasts.
What does Jira give you on its own?
Four reports, all for Scrum boards in company-managed spaces.
- Velocity chart. Per recent sprint, a grey bar for the estimate committed at the start and a green bar for the estimate completed at the end, with an average line.
- Sprint report. One sprint at a time: a burndown, a list of work items by completion, an asterisk on work added after the start.
- Epic burndown. A predicted number of sprints left for an epic.
- Release burndown. The same idea for a release (a version).
The epic and release reports predict from your velocity over the last three sprints and the work remaining. They show sprints, not calendar dates, and they warn when too many work items are unestimated.
All of it is free with Jira, needs no setup, and is in the place your team already looks. Read more in how to read the Jira velocity chart and the Jira sprint report explained.
What does Bunlings add?
Two separate apps, each with a free edition for one board. Both are read-only and use no outside servers.
Bunlings Sprint History tells the story of past sprints:
- Each sprint is a jar of plan, finished and joined-later work, with a sentence for what the team usually finishes.
- Work that joined later never makes the plan look bigger.
- Every number opens the work items behind it, and a line says when Jira’s report likely shows something else.
- How long each estimate actually took, in working days.
- Flow pages: burn-up, finished per week, how long, needs a look, piling up.
- Points, items or hours.
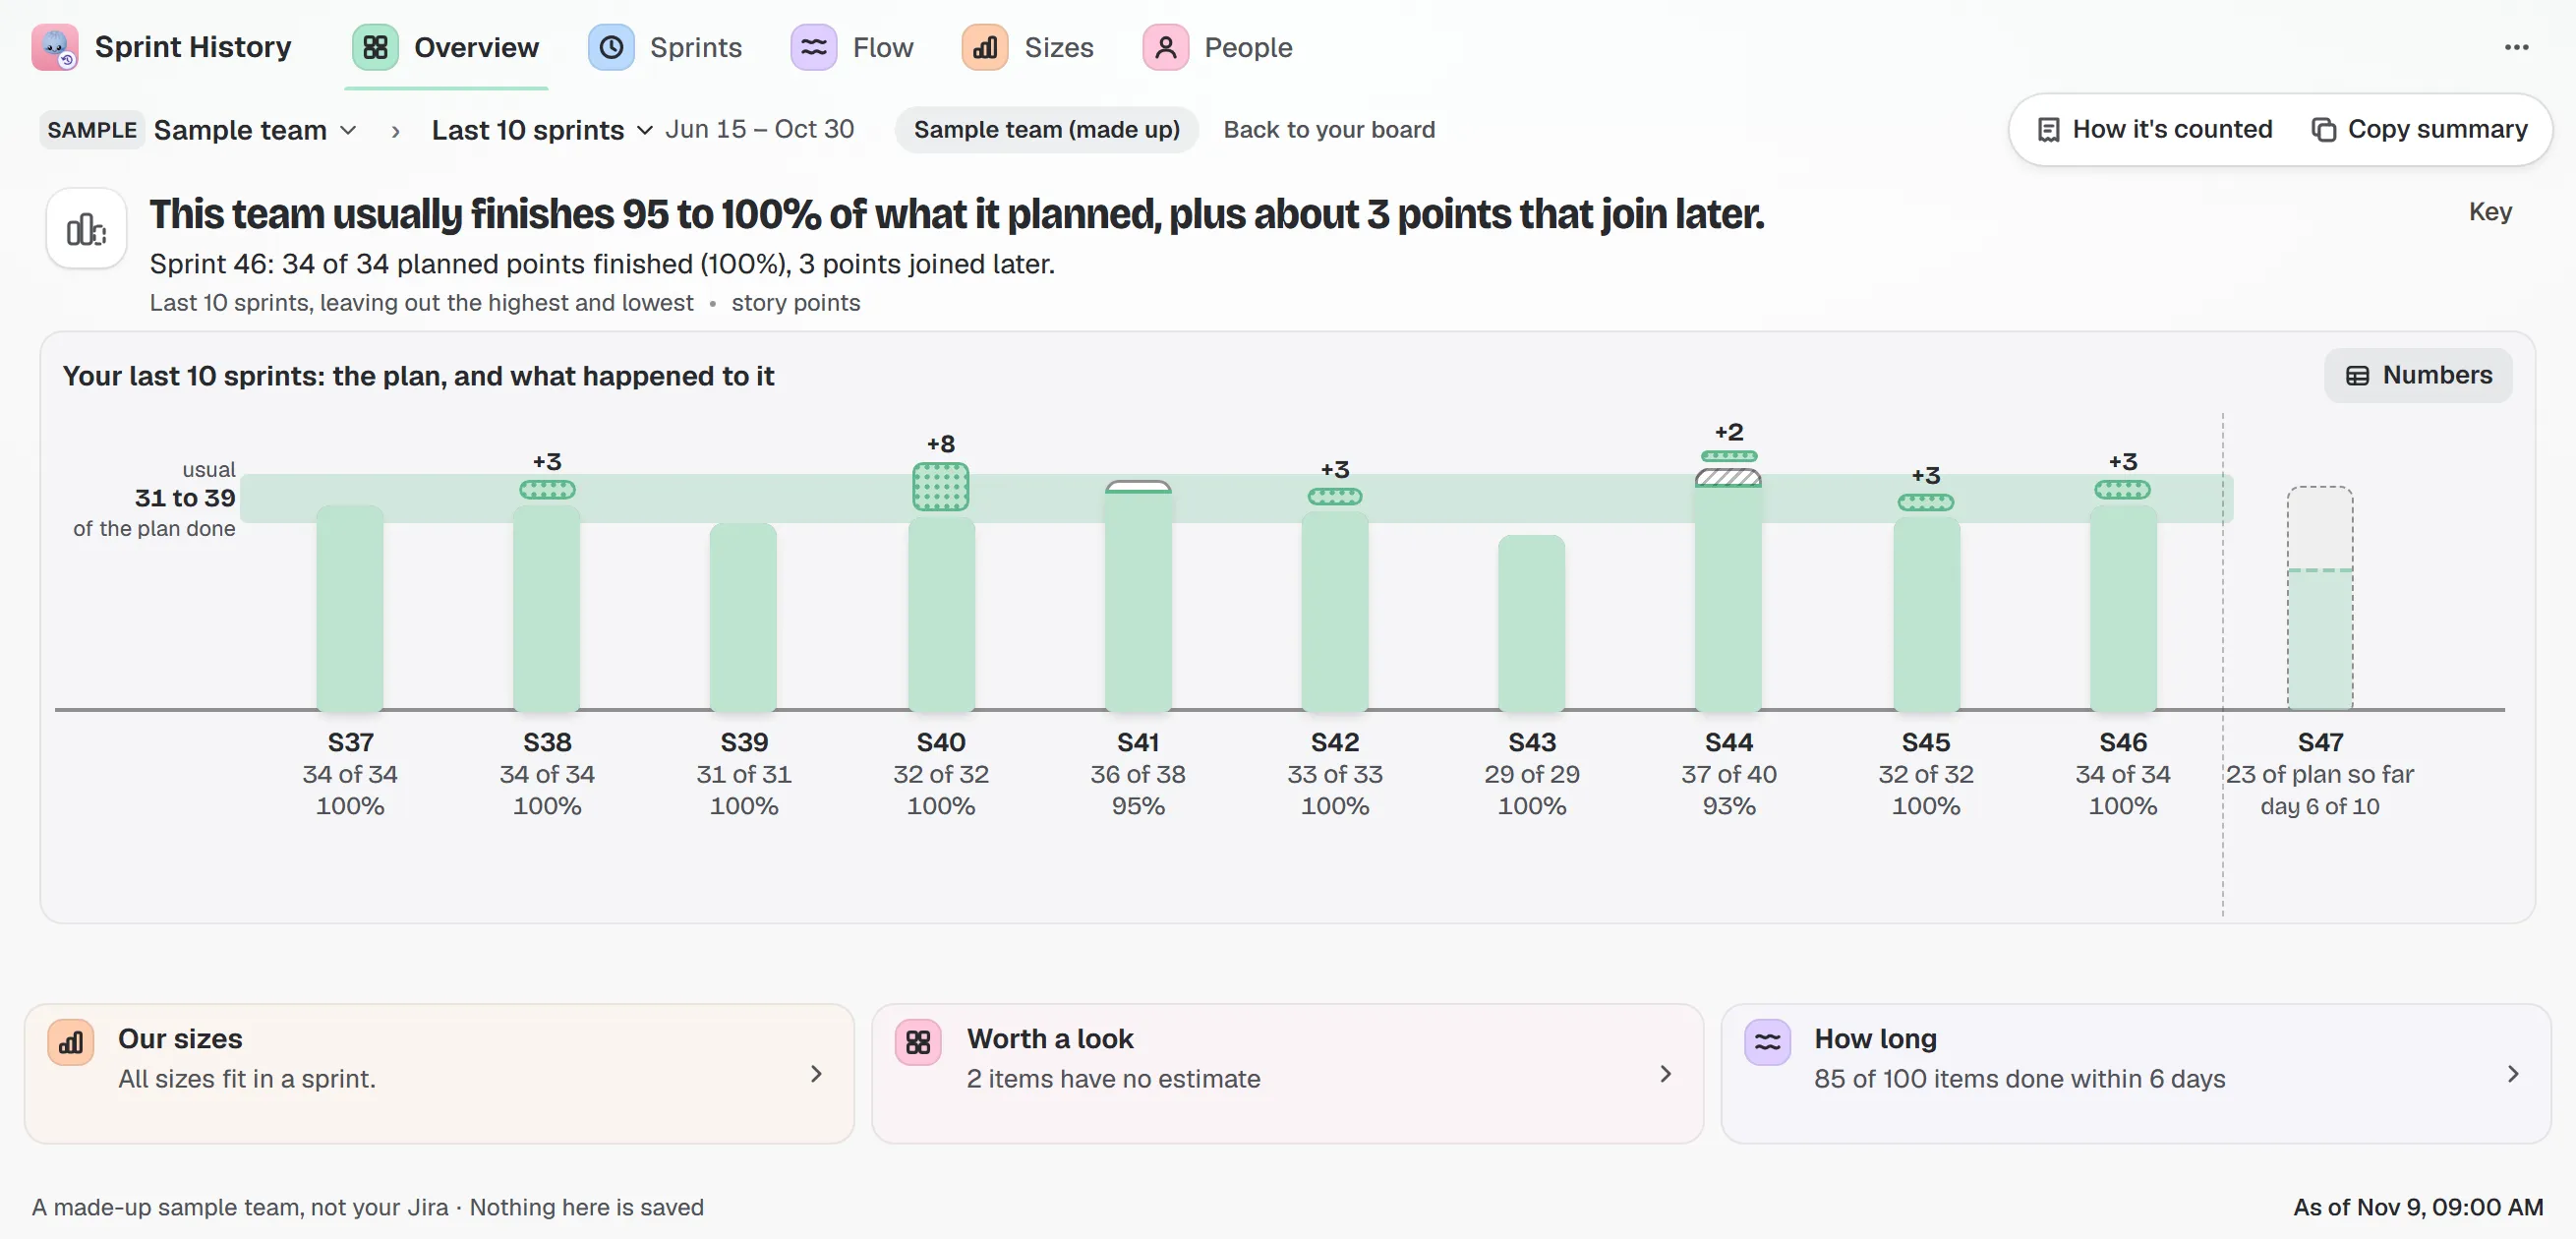
Sample team and sample data. Plan, finished from it, and what joined later.
Bunlings Sprint Forecast looks forward:
- “Will this sprint fit?”, answered in one sentence, with how many of your last ten sprints would have finished the plan.
- A cut line to drag, and “Try adding” a backlog item to see the odds change.
- Capacity: each person against their own usual range, away days included.
- A likely finish date for epics, releases and saved filters.
- Track record, which keeps score of its own calls.
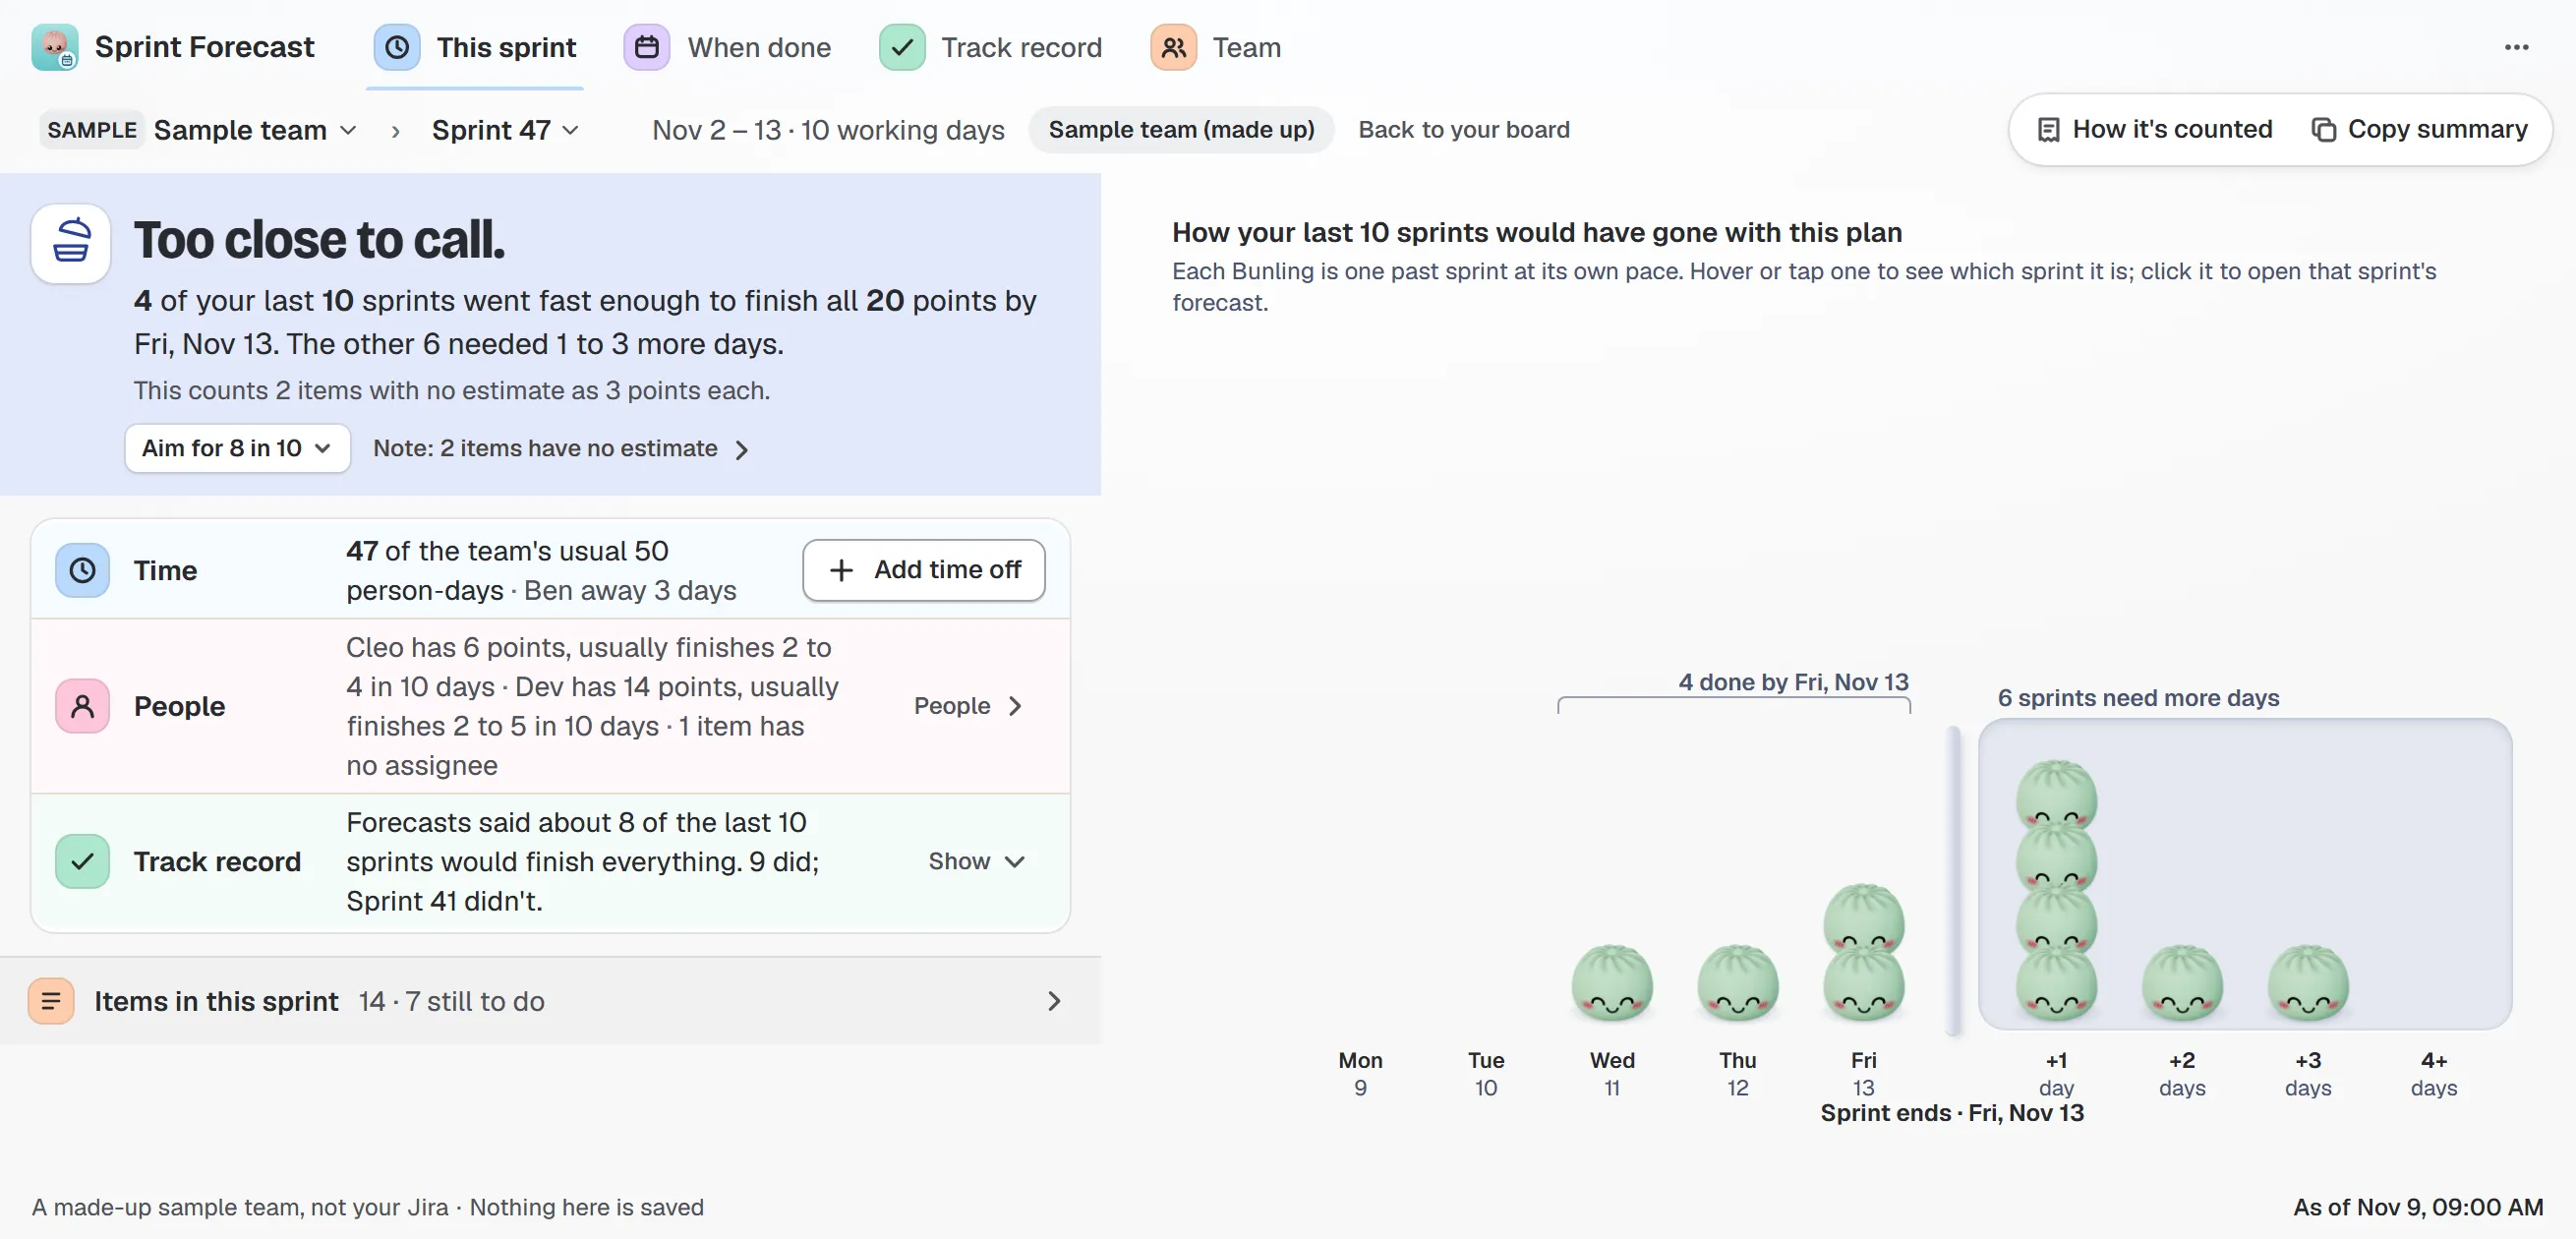
Sample team and sample data. Each little Bunling is one past sprint.
How do they compare, point by point?
| Question | Jira’s own reports | Bunlings |
|---|---|---|
| What did we finish per sprint? | Velocity chart, completed bar | Sprint History, finished from the plan and joined later, separately |
| What was committed? | Grey bar, frozen at the start | The plan at the start, with taken-out work still in it |
| Did work join mid-sprint? | Asterisk in the sprint report, steps in the burndown | Dotted block on the jar, “joined later” line, scope line on the burn-up |
| What is usual for us? | Average line | A usual range, with the highest and lowest sprint left out |
| How long did each estimate actually take? | Not in these four reports | Working days per estimate, with the work items |
| Will this sprint fit? | Not answered with a chance | One sentence, with how many of your last ten sprints fit |
| When will this epic or release be done? | A predicted number of sprints | A likely date with a chance, and a check against Jira’s target date |
| Where do the numbers come from? | Documented in Atlassian’s pages | “How it’s counted” lists every rule, and each number opens its work items |
| Unit | The board’s estimation setting | Points, items or hours, switchable per view |
| Writes to Jira | No | No, read-only |
| Cost | Included with Jira | Free edition for one board; the full apps add more boards and gadgets |
If the app’s total differs from what Jira likely shows, the app says by how much and why.
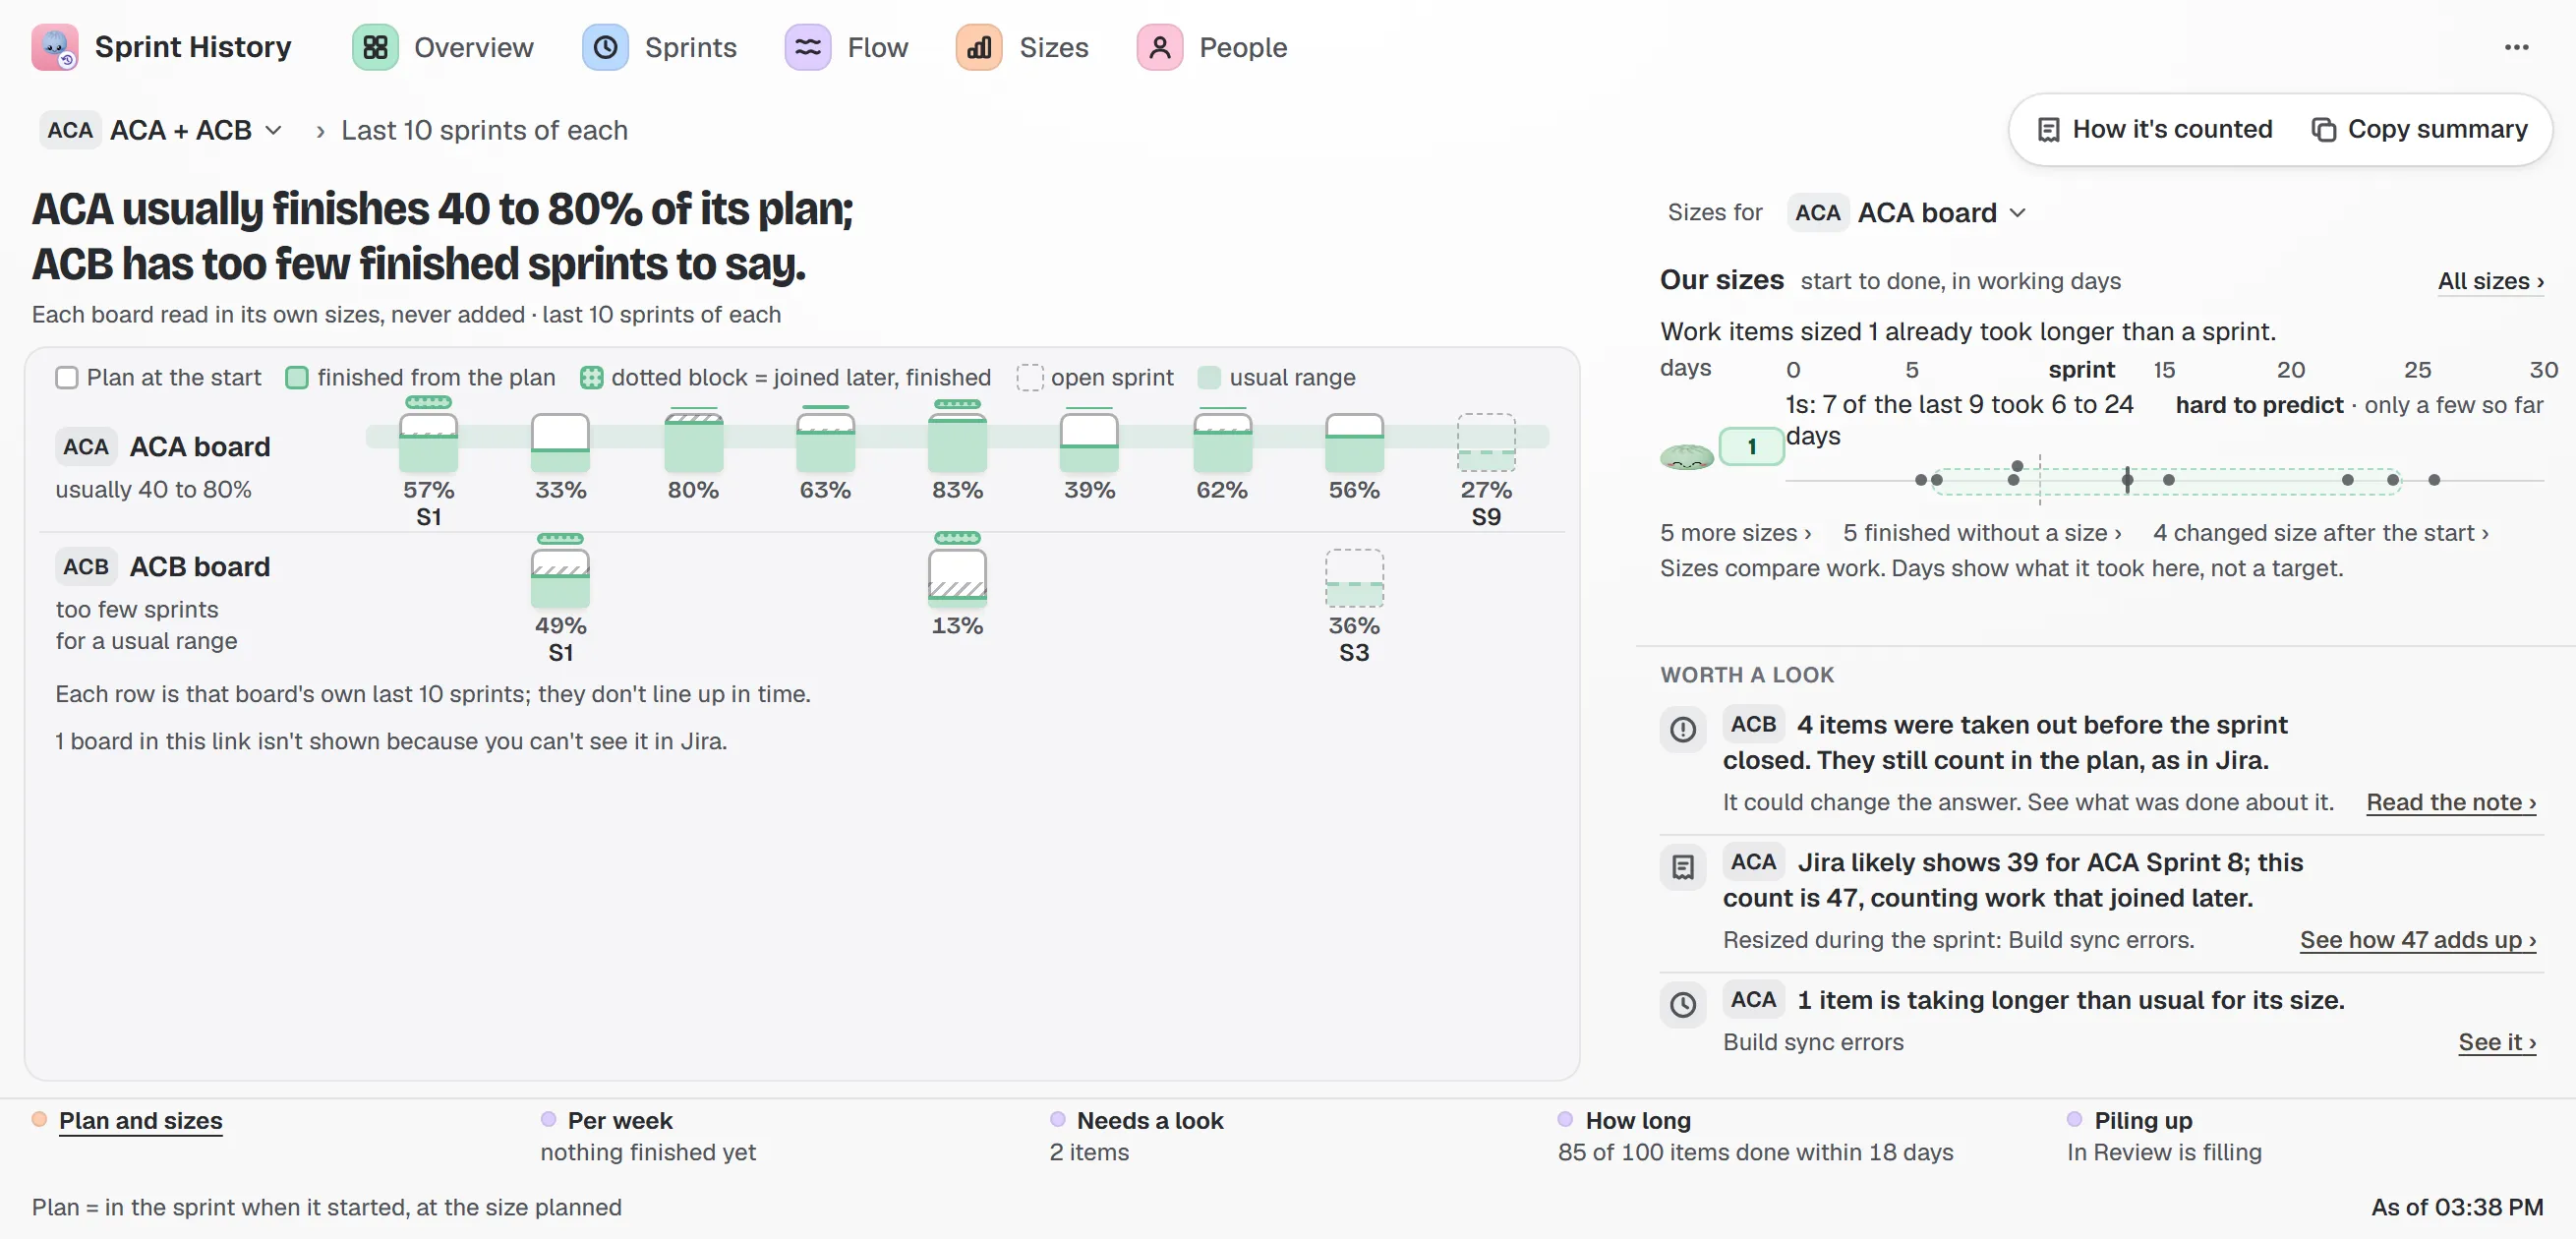
Sample boards and sample data. When the count differs from Jira’s, a line says why.
When are Jira’s own reports enough?
More often than an app vendor would like to admit. Stay with Jira’s reports when:
- Your team is steady. Velocity moves little from sprint to sprint, and work rarely joins mid-sprint. The average line is then a fair guide.
- Nobody asks for dates. If the question never comes up beyond “are we on track?”, the burndown answers it.
- One board, one team, and one person reads the reports. You do not need receipts for every number when everyone knows the story.
- A single number is fine. For some teams, “about 25 a sprint” is all the planning needs.
- You do not want another app. That is a good reason too.
Even then, two free habits pay off: read the velocity chart as a range, and look at the asterisks in the sprint report.
When is it worth adding Bunlings?
- Work joins mid-sprint all the time. The velocity chart then looks better than the sprint was. Sprint History separates the two.
- You get asked “will it fit?” or “when will it be done?” None of these four reports gives a chance for either, and a range with a proof is easier to defend than one line.
- Teams quote numbers that do not match. The receipts and the “Jira likely shows” line settle the argument.
- You want to know how long a 5 actually takes on your board. The Sizes report shows it.
- You run several boards. Sprint History can show them side by side, each against its own plan.
How trustworthy are the forecasts?
Bunlings Sprint Forecast was tested on 5,579 real sprint starts from 10 public Jira trackers it was not tuned on. Its chances agreed with what happened to within about 4 points on average, even when the easy “none would fit” calls were left out. The limit: those were loose public trackers with no disciplined team in the data, so the test says nothing wider about a tightly run team. The app also keeps score of its own calls on your board. Being 85% sure explains what the odds mean.
What does it cost, and where does the data go?
Each app has a free edition for one board. The full apps add more boards, dashboard gadgets and a few extras, and are priced per user on the product pages. Atlassian bills every Jira user on your site, so check the number before installing. Both apps are read-only and do not use outside servers.
Try it
- Bunlings Sprint History and Free Sprint History
- Bunlings Sprint Forecast and Free Sprint Forecast
- For estimation and retros, see Native Jira vs Bunlings