
 Bunlings: sprint apps for Jira





Every forecast needs a unit. “We finish about 26” means nothing until you say 26 what: points, work items, hours.
The choice is smaller than it sounds, and you do not have to commit. Here is what each unit is good at, and a simple way to find out which one works for your team.
What are the three units?
- Story points: a relative size, agreed by the team. Velocity is the total points finished per sprint.
- Work item count: how many work items were finished. No estimates needed. This is throughput.
- Hours: time estimates, usually the original estimate on each work item.
Jira’s velocity chart can use any of them. The board’s estimation setting decides: Story Points, original time, a numeric field, or work item count. Atlassian describes the options on the velocity chart page. That setting belongs to the whole board, so ask your board admin before changing it, and switch it back afterwards.
How do they compare?
| Story points | Item counts | Hours | |
|---|---|---|---|
| Needs estimates | Yes, on every work item | No | Yes, in time |
| Quick to keep up | Needs a ritual | Free | Needs a ritual, often a long one |
| Hides size differences | Partly | Yes, a tiny and a huge item count the same | Partly |
| Honest about | Relative effort | Pace of finishing | Planned time, not time spent |
| Good for | Teams that already estimate and trust it | Kanban, teams without estimates, similar-sized work | Teams that bill or plan in time |
| Breaks when | A 5 changes meaning over time | Sizes vary a lot | Estimates are guesses nobody revisits |
When do item counts beat points?
Often. Counting works well when:
- the work items are mostly of a similar size, or your team splits them to keep them that way;
- the team does not estimate, or estimates inconsistently;
- you run Kanban, where there is no sprint to put points in.
It struggles when sizes vary a lot. One huge work item and nine tiny ones count as ten. If that is your board, splitting the huge ones is the fix, not switching unit. Velocity vs throughput for sprint planning goes through that choice.
When do points beat counts?
When the sizes carry real information. If your team sizes a 1 and a 13 and they really do take about a day and about two weeks, points keep that, and counts lose it.
This depends on one thing: do the sizes mean something stable? A good test is to look at how long each size actually took. If 5s sometimes take two days and sometimes two weeks, the size is not doing its job, and points will give you a confident-looking number built on shifting ground. Why estimates are off covers the usual reasons.
When are hours the right unit?
When the team already plans in hours, and the original estimates are filled in on most work items. Hours are a fair unit for work that is billed or scheduled by time. They are a poor one when the field is mostly empty: a total of hours on a board where one work item in five has an estimate is mostly a total of the habit of filling it in.
How do you find out which one works for you?
Run both for a month. You do not need a second tool.
- Points: note the completed bar from the Velocity chart for each sprint.
- Counts: note how many work items were finished in each sprint with a filter such as
project = ABC AND sprint = "Sprint 12" AND statusCategory = Done, one sprint at a time. (JQL still calls a spaceproject.) - Compare the two lists.
A made-up team, six sprints:
| Sprint | Points finished | Work items finished |
|---|---|---|
| 1 | 24 | 8 |
| 2 | 31 | 10 |
| 3 | 27 | 9 |
| 4 | 19 | 6 |
| 5 | 29 | 10 |
| 6 | 26 | 8 |
Both columns go up and down together. That is a good sign: either unit would give you the same story, and the simpler one is the count. If the columns disagree, say sprint 4 had 19 points but 11 work items, that sprint is worth a look in the retro. Either a few big items hid in the plan, or the sizes are not telling you much.
How do the Bunlings apps handle the choice?
Bunlings Sprint Forecast and Bunlings Sprint History are Jira apps that count in what your team uses. Story points if the board has a points field with enough values, hours if the team sizes in hours, and work items if there are few or no estimates. The unit is in every sentence (“41 points”, “9 items”, “36 hours”), so you always know which one you are reading.
If most work items in a sprint have no estimate, the app counts items on its own and says so. A few unestimated items on an otherwise estimated board count at your team’s usual size, never as zero, and a note lists them.
In Sprint History, a small control lets you look at the same board in points, items or hours. One click recounts the whole page. “Hours” works when enough work items have an original estimate; if too few do, it is dimmed and says why. In Sprint Forecast, when counting items instead would change the answer by 2 or more in 10, the proof adds one sentence with the other unit, and a button to switch your view.
To see whether your sizes mean something, the Sizes page shows how long each size took on this board, in working days, with the work items behind it.
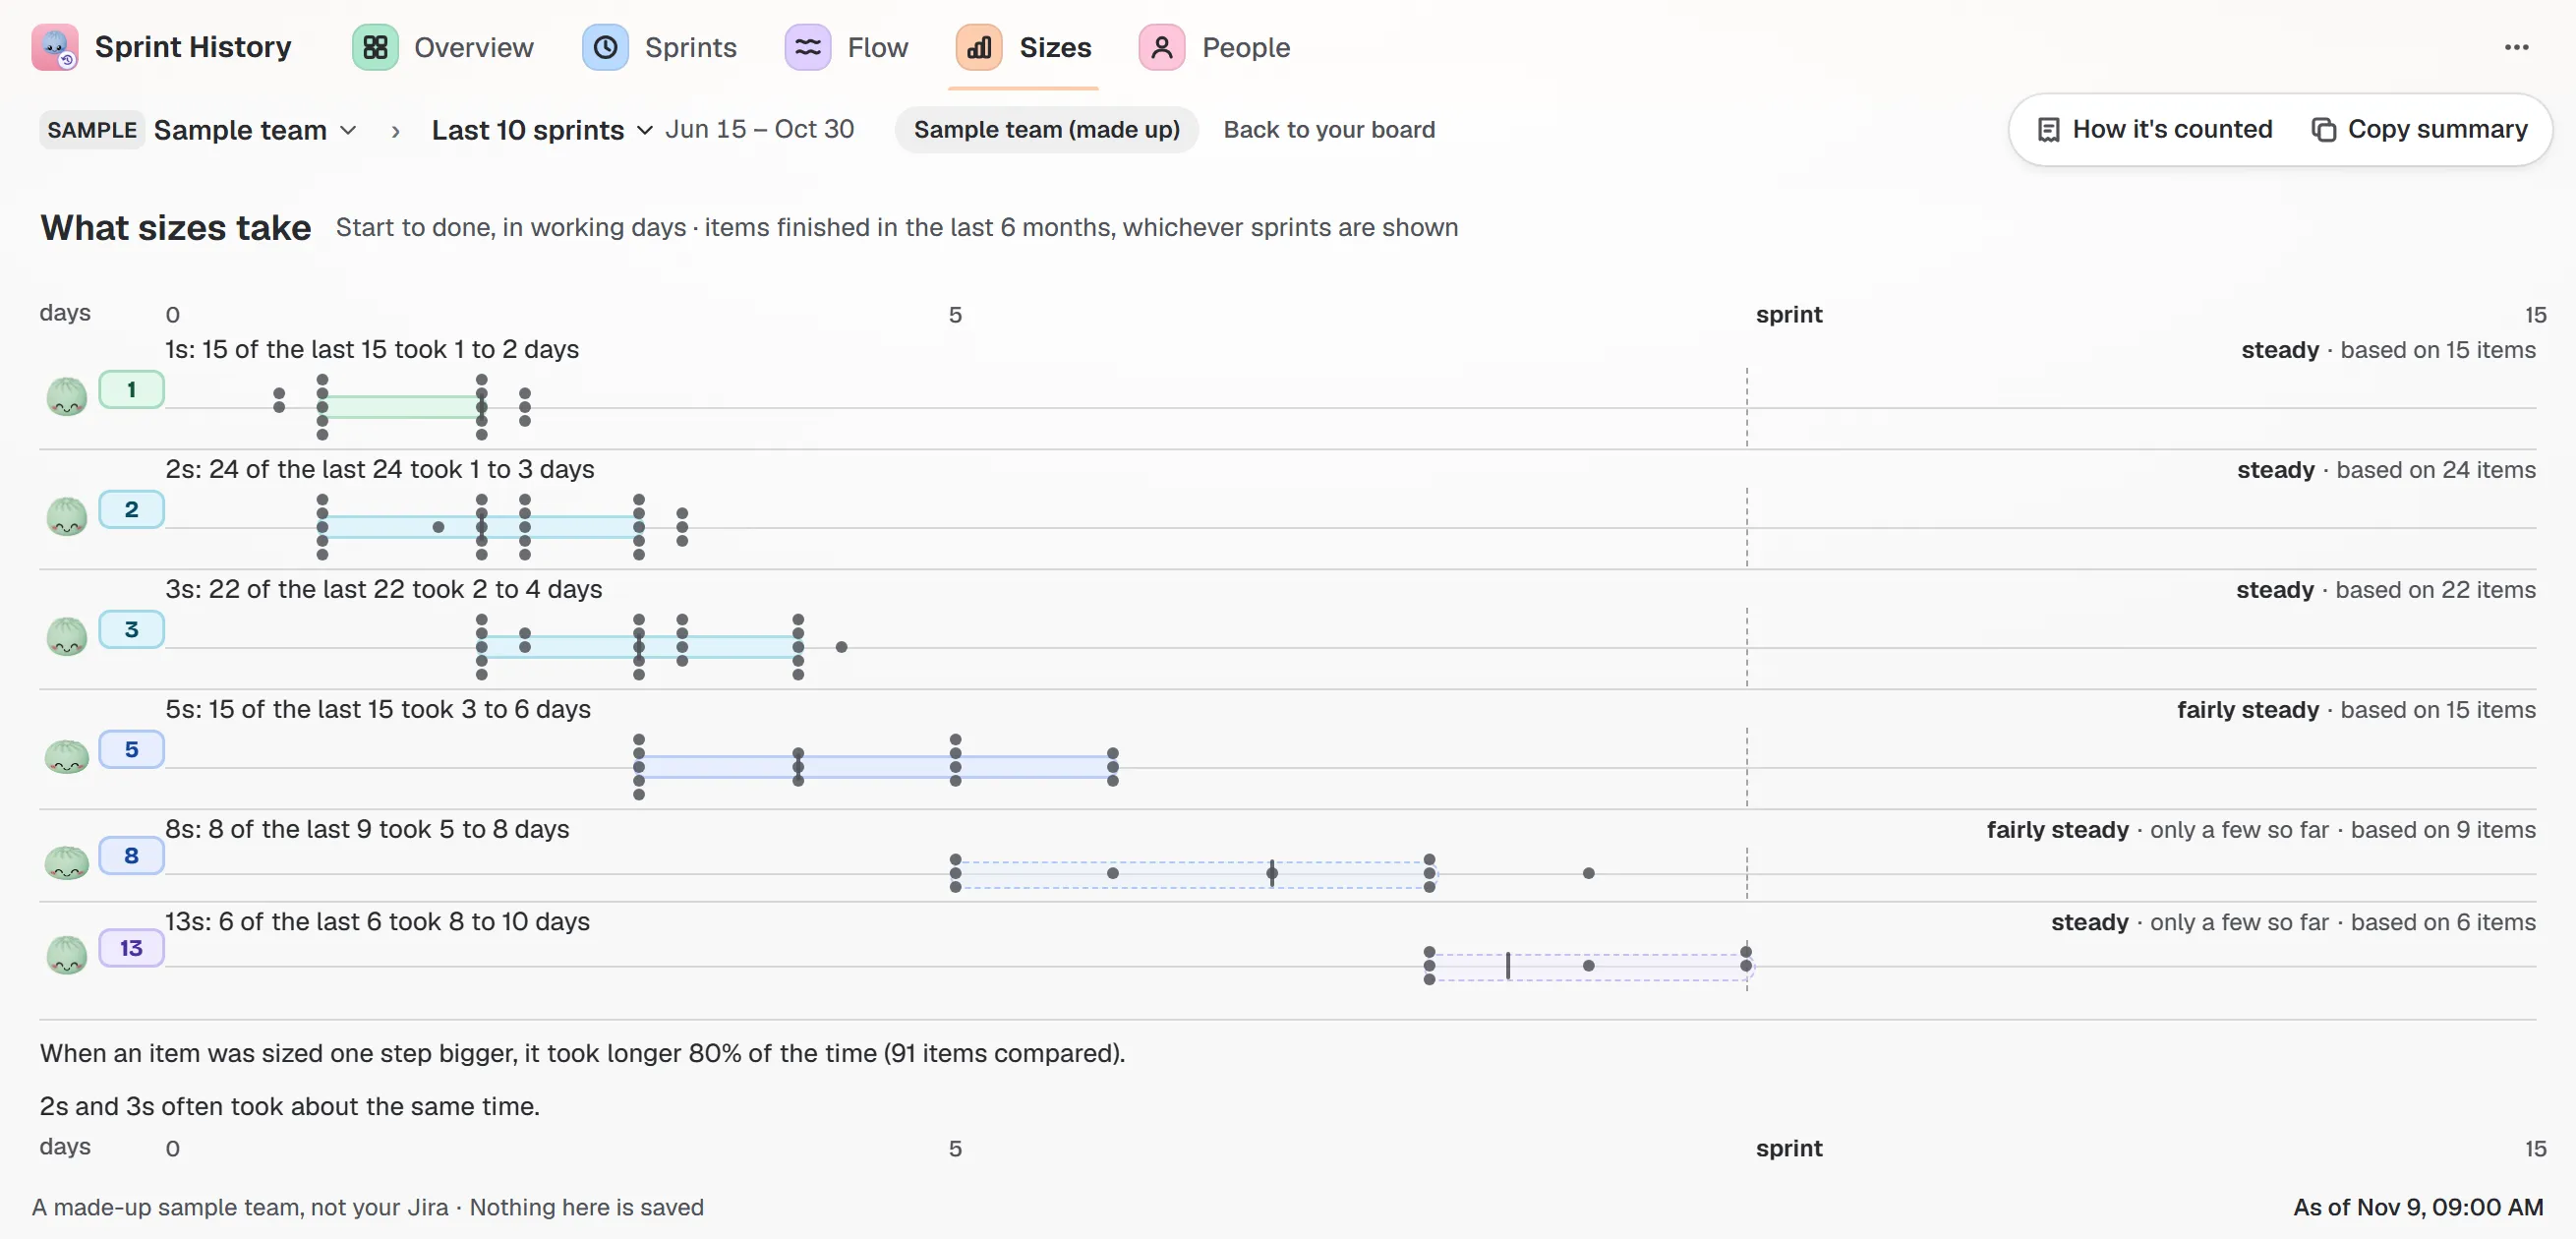
Sample team and sample data. “5s: 15 of the last 15 took 3 to 6 days.” Sizes compare work; days show how long work actually took here, not a target.
For a board with no sprints, items are the unit, and Sprint History tells history week by week.
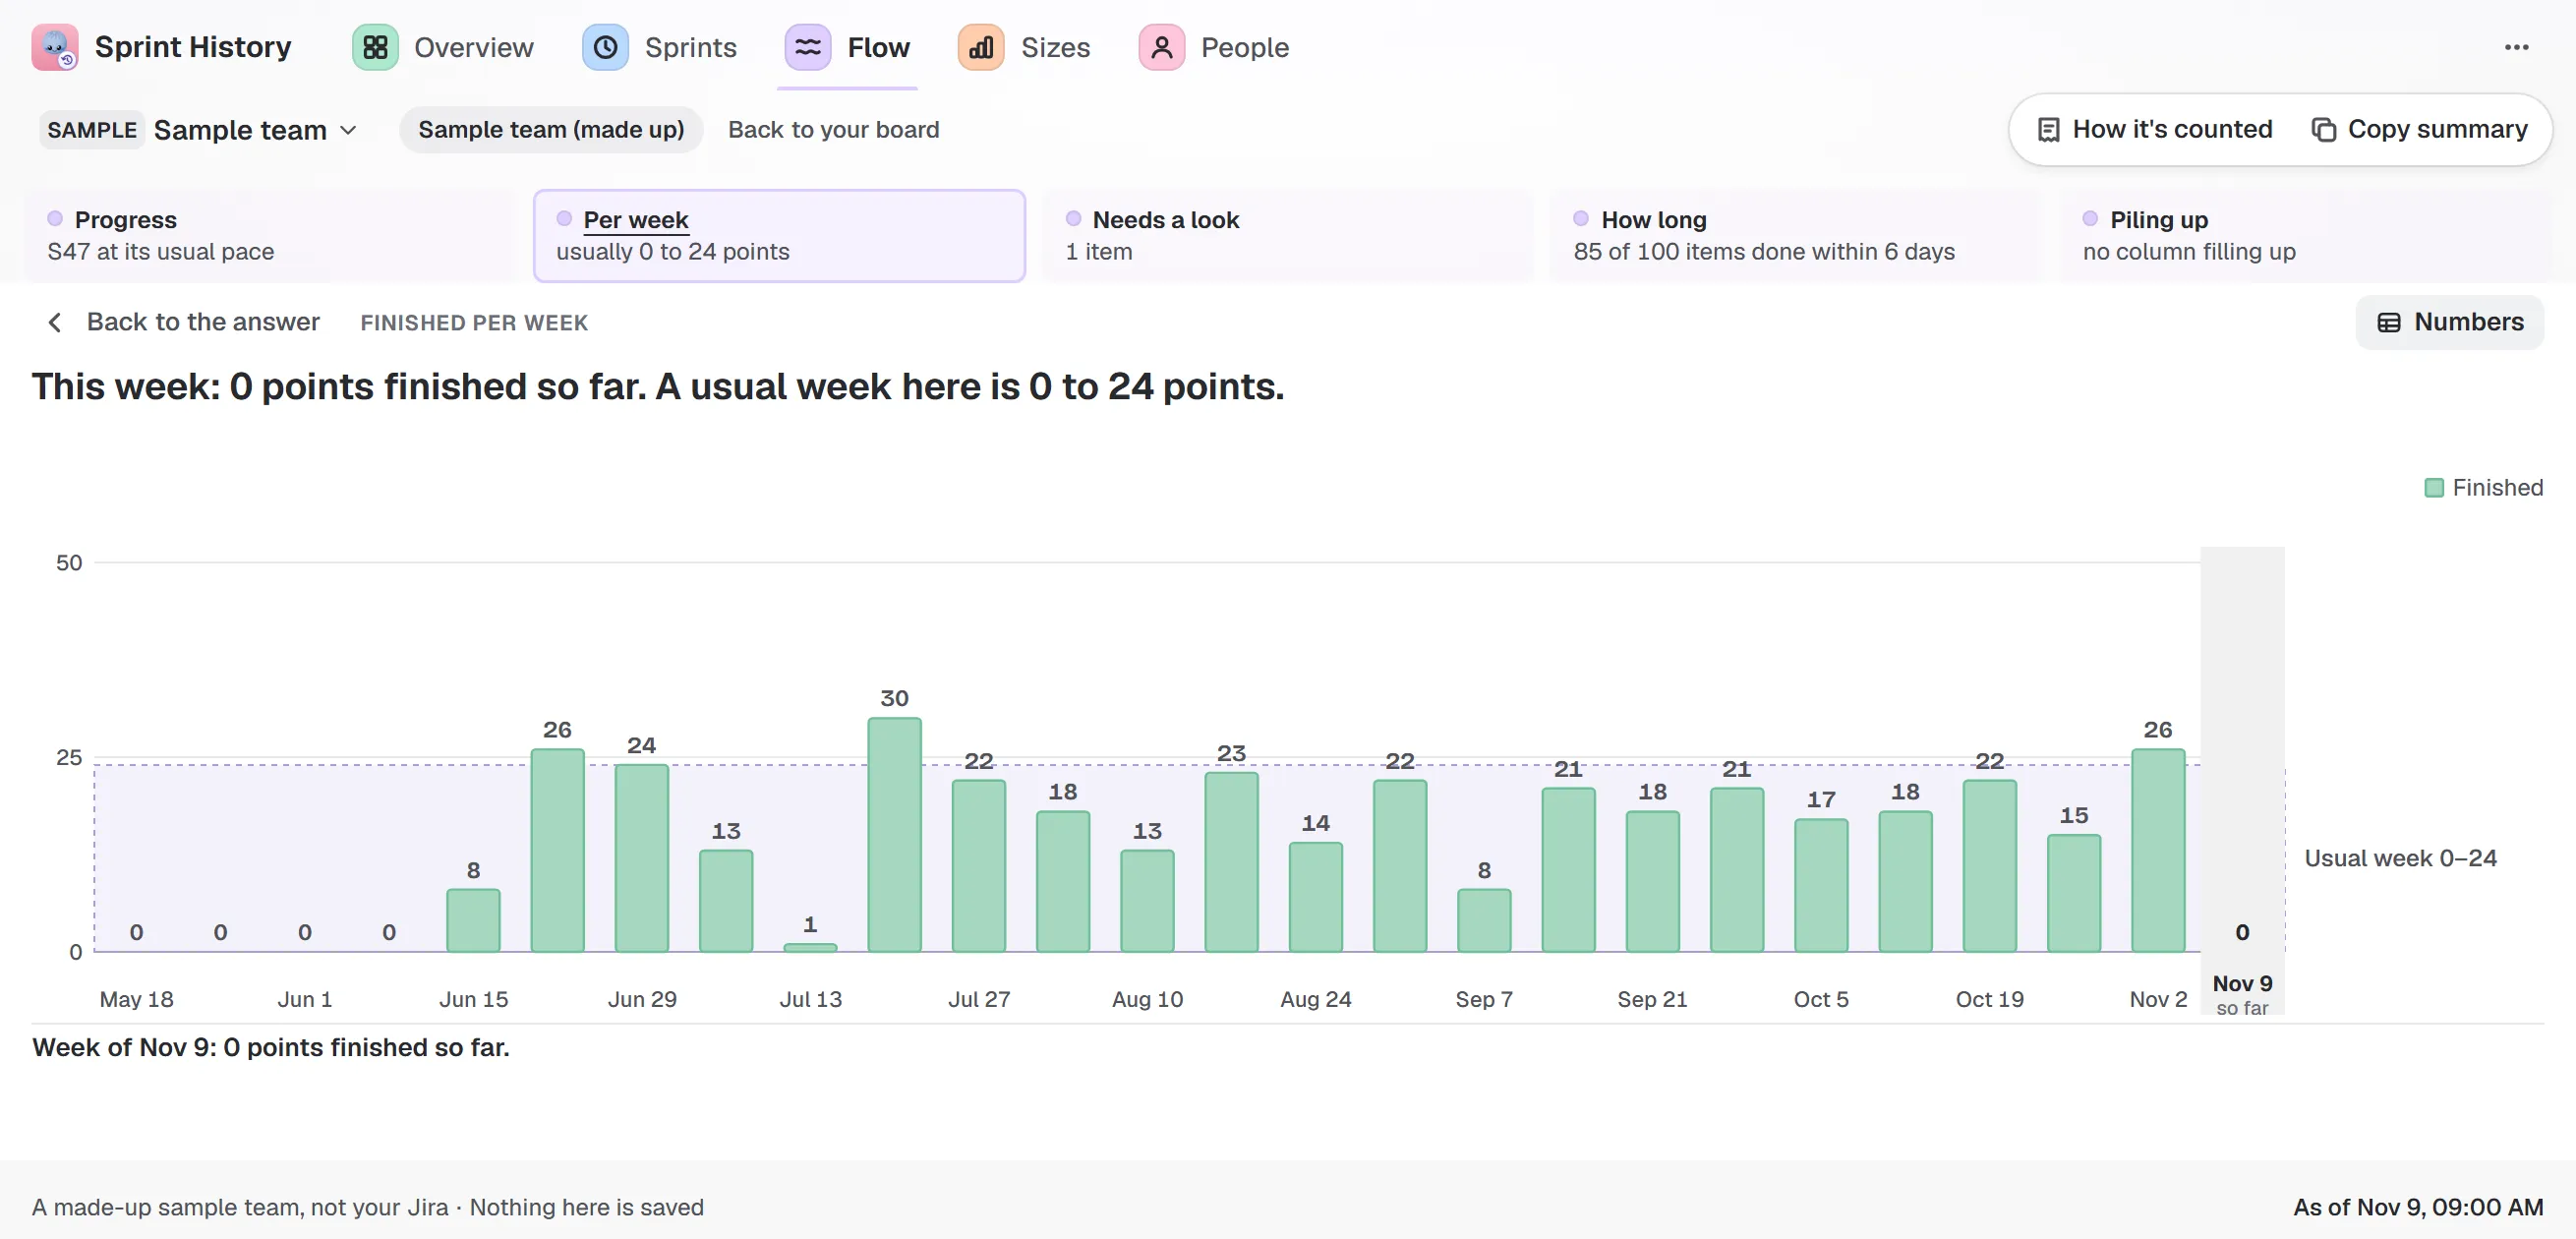
Sample team and sample data. Finished per week, with the usual range as a band.
The guide on points, items or hours covers the switch and the rules for hours.
Which one should you pick?
The one your team already keeps up. A short test:
- Do the sizes mean something stable? Use points.
- Do work items tend to be of a similar size, or do you not estimate? Use counts.
- Is the time estimate filled in on most work items? Hours are fair.
- Not sure? Forecast in two units for a month, and trust it more when they agree.
Try it
- Bunlings Sprint History
- Bunlings Sprint Forecast
- Free Sprint History and Free Sprint Forecast, each for one board