
 Bunlings: sprint apps for Jira





“Are you sure?” is a bad question for a forecast, and every team gets it anyway.
The honest answer is never “yes”. It is a number: how sure, and what it would take to be surer. This is what that number means, with no maths wall.
What does “85% sure” actually mean?
It means that, in 85 out of 100 situations like this one, the work was done by that date. In the other 15, it was not.
Nothing about your sprint changes because of the number. It is a way of describing how often things like this went right before. Rain forecasts work the same way: “80 percent chance of rain” does not mean it rains 80 percent of the time in one place. It means that on days that looked like this, it rained about 8 days in 10.
So there are two things to remember:
- A forecast of 8 in 10 is wrong 2 times in 10, by design. That is not a failure.
- A forecast that is never wrong is not a forecast. It is a date with padding.
Where does the number come from?
From counting. The simplest honest method uses your own past:
- Take your last ten sprints.
- For each one, ask: at its own pace, would it have finished this plan by the sprint end?
- Count the yeses.
Eight yeses is “8 in 10”. That is the whole idea. Nothing is guessed about how the team might behave, and no bell curve is assumed. The input is what actually happened.
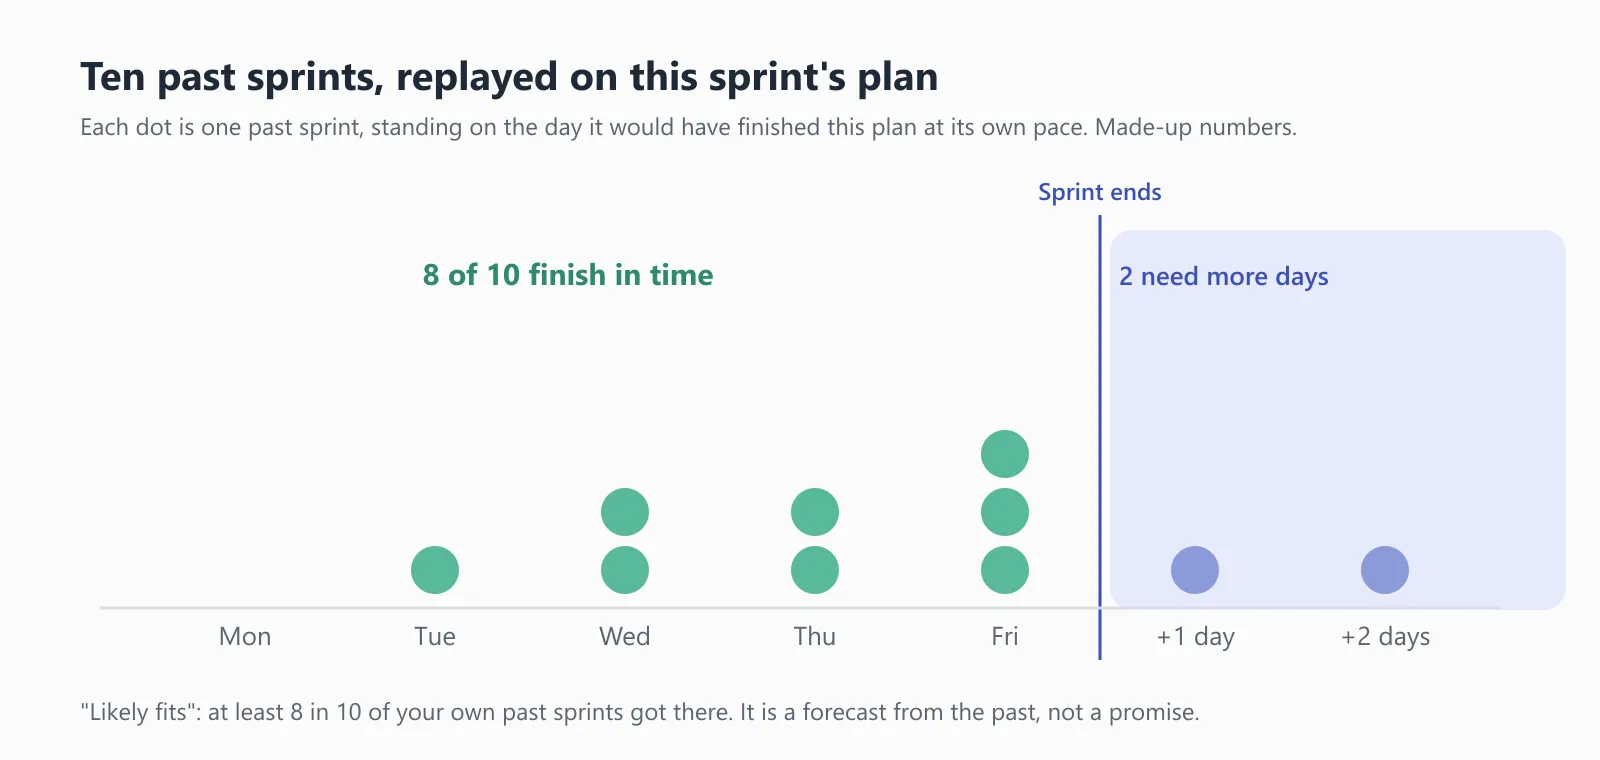
An illustration with made-up numbers. Each dot is one past sprint.
People call the general technique a Monte Carlo simulation. In the plain form used here, the “dice” are your own past sprints, replayed.
Why does a surer answer mean more days?
Because being surer means covering more of the unlucky sprints. Line your ten past sprints up by the day each would have finished. The more of them you want covered, the further down the line you go.
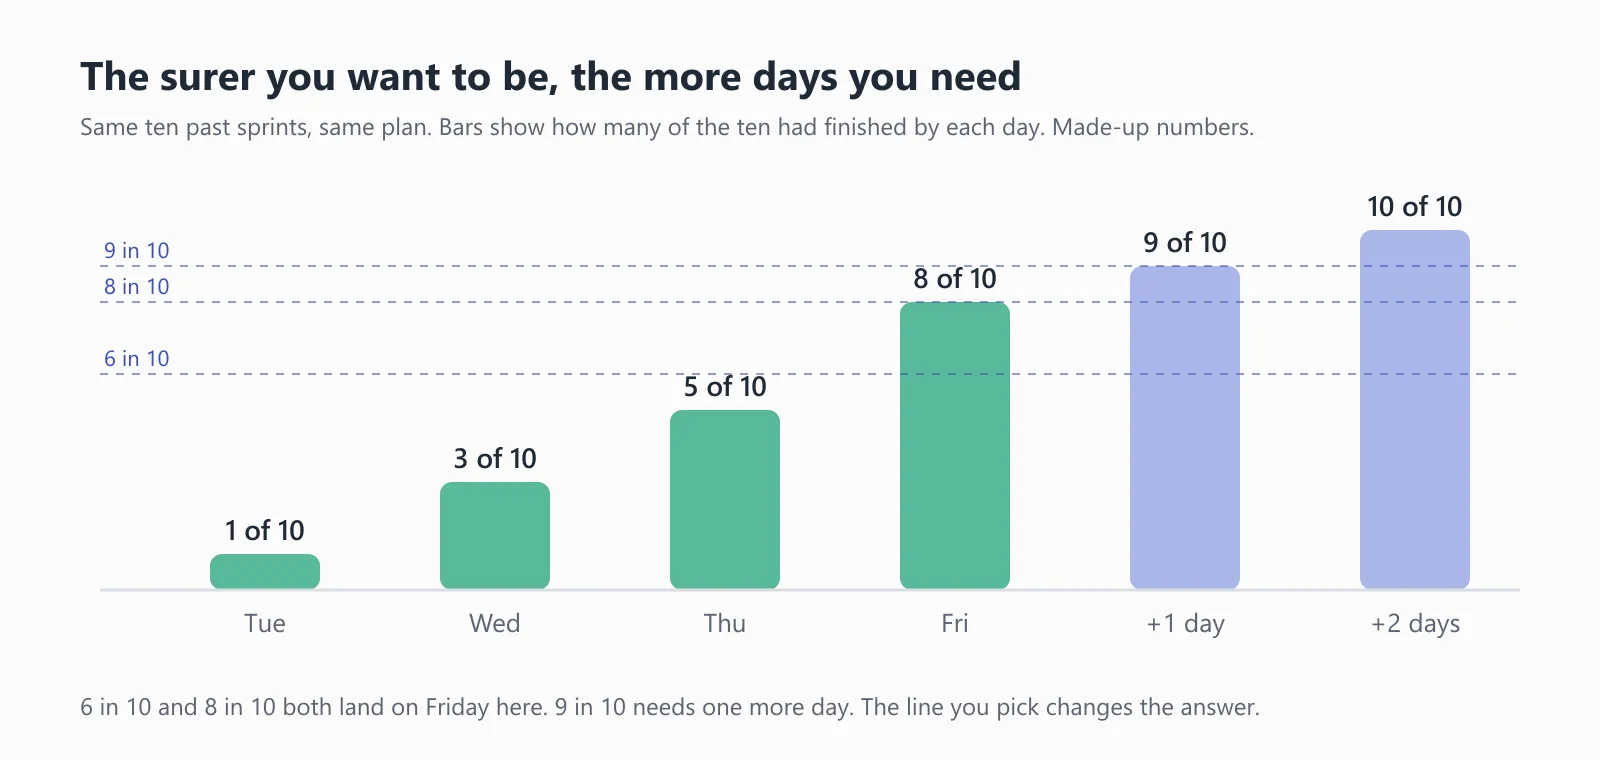
An illustration with made-up numbers. 6 in 10 and 8 in 10 both land on Friday here. 9 in 10 needs one more day.
That is why Bunlings Sprint Forecast lets you choose how sure you want to be: “Normal” is 6 in 10, “It matters” is 8 in 10, “Release on the line” is 9 in 10. A higher aim asks for more days to spare. Pick the aim to match what happens if you are wrong, not to match your mood.
How do you choose how sure to be?
Ask what a miss costs.
| If a miss means | A fair aim |
|---|---|
| A work item moves to next sprint, nobody cares | 6 in 10 |
| An awkward review, an apology | 8 in 10 |
| A date promised to a customer or a launch | 9 in 10 |
And remember that 10 in 10 is not on the menu. Ten past sprints cannot rule out an eleventh that goes worse than all of them.
What does “too close to call” mean?
It means about half of your past sprints would have finished this plan in time and half would not. That is not a cop-out, it is a finding: the plan sits right on the edge of what your team does.
When you see it, do not argue about the number. Ask which work items to move to the bottom of the list, and see what it does to the odds.
Can you trust the odds?
Fair question, and the only fair test is to check them against what happened. Bunlings Sprint Forecast was tested on 5,579 real sprint starts from 10 public Jira trackers that it was not tuned on. Its chances agreed with what happened to within about 4 points on average, even when the easy “none would fit” calls were left out.
There is a limit, and it matters. Those were loose public trackers, with no disciplined team in the data, so the test says nothing wider about how a tightly run team would score. It does not mean “8 in 10” is exactly 8 in 10 for you either.
So the app also keeps score of its own calls on your board. Track record lists what it said for each sprint and what happened, and tells you if it was too hopeful.
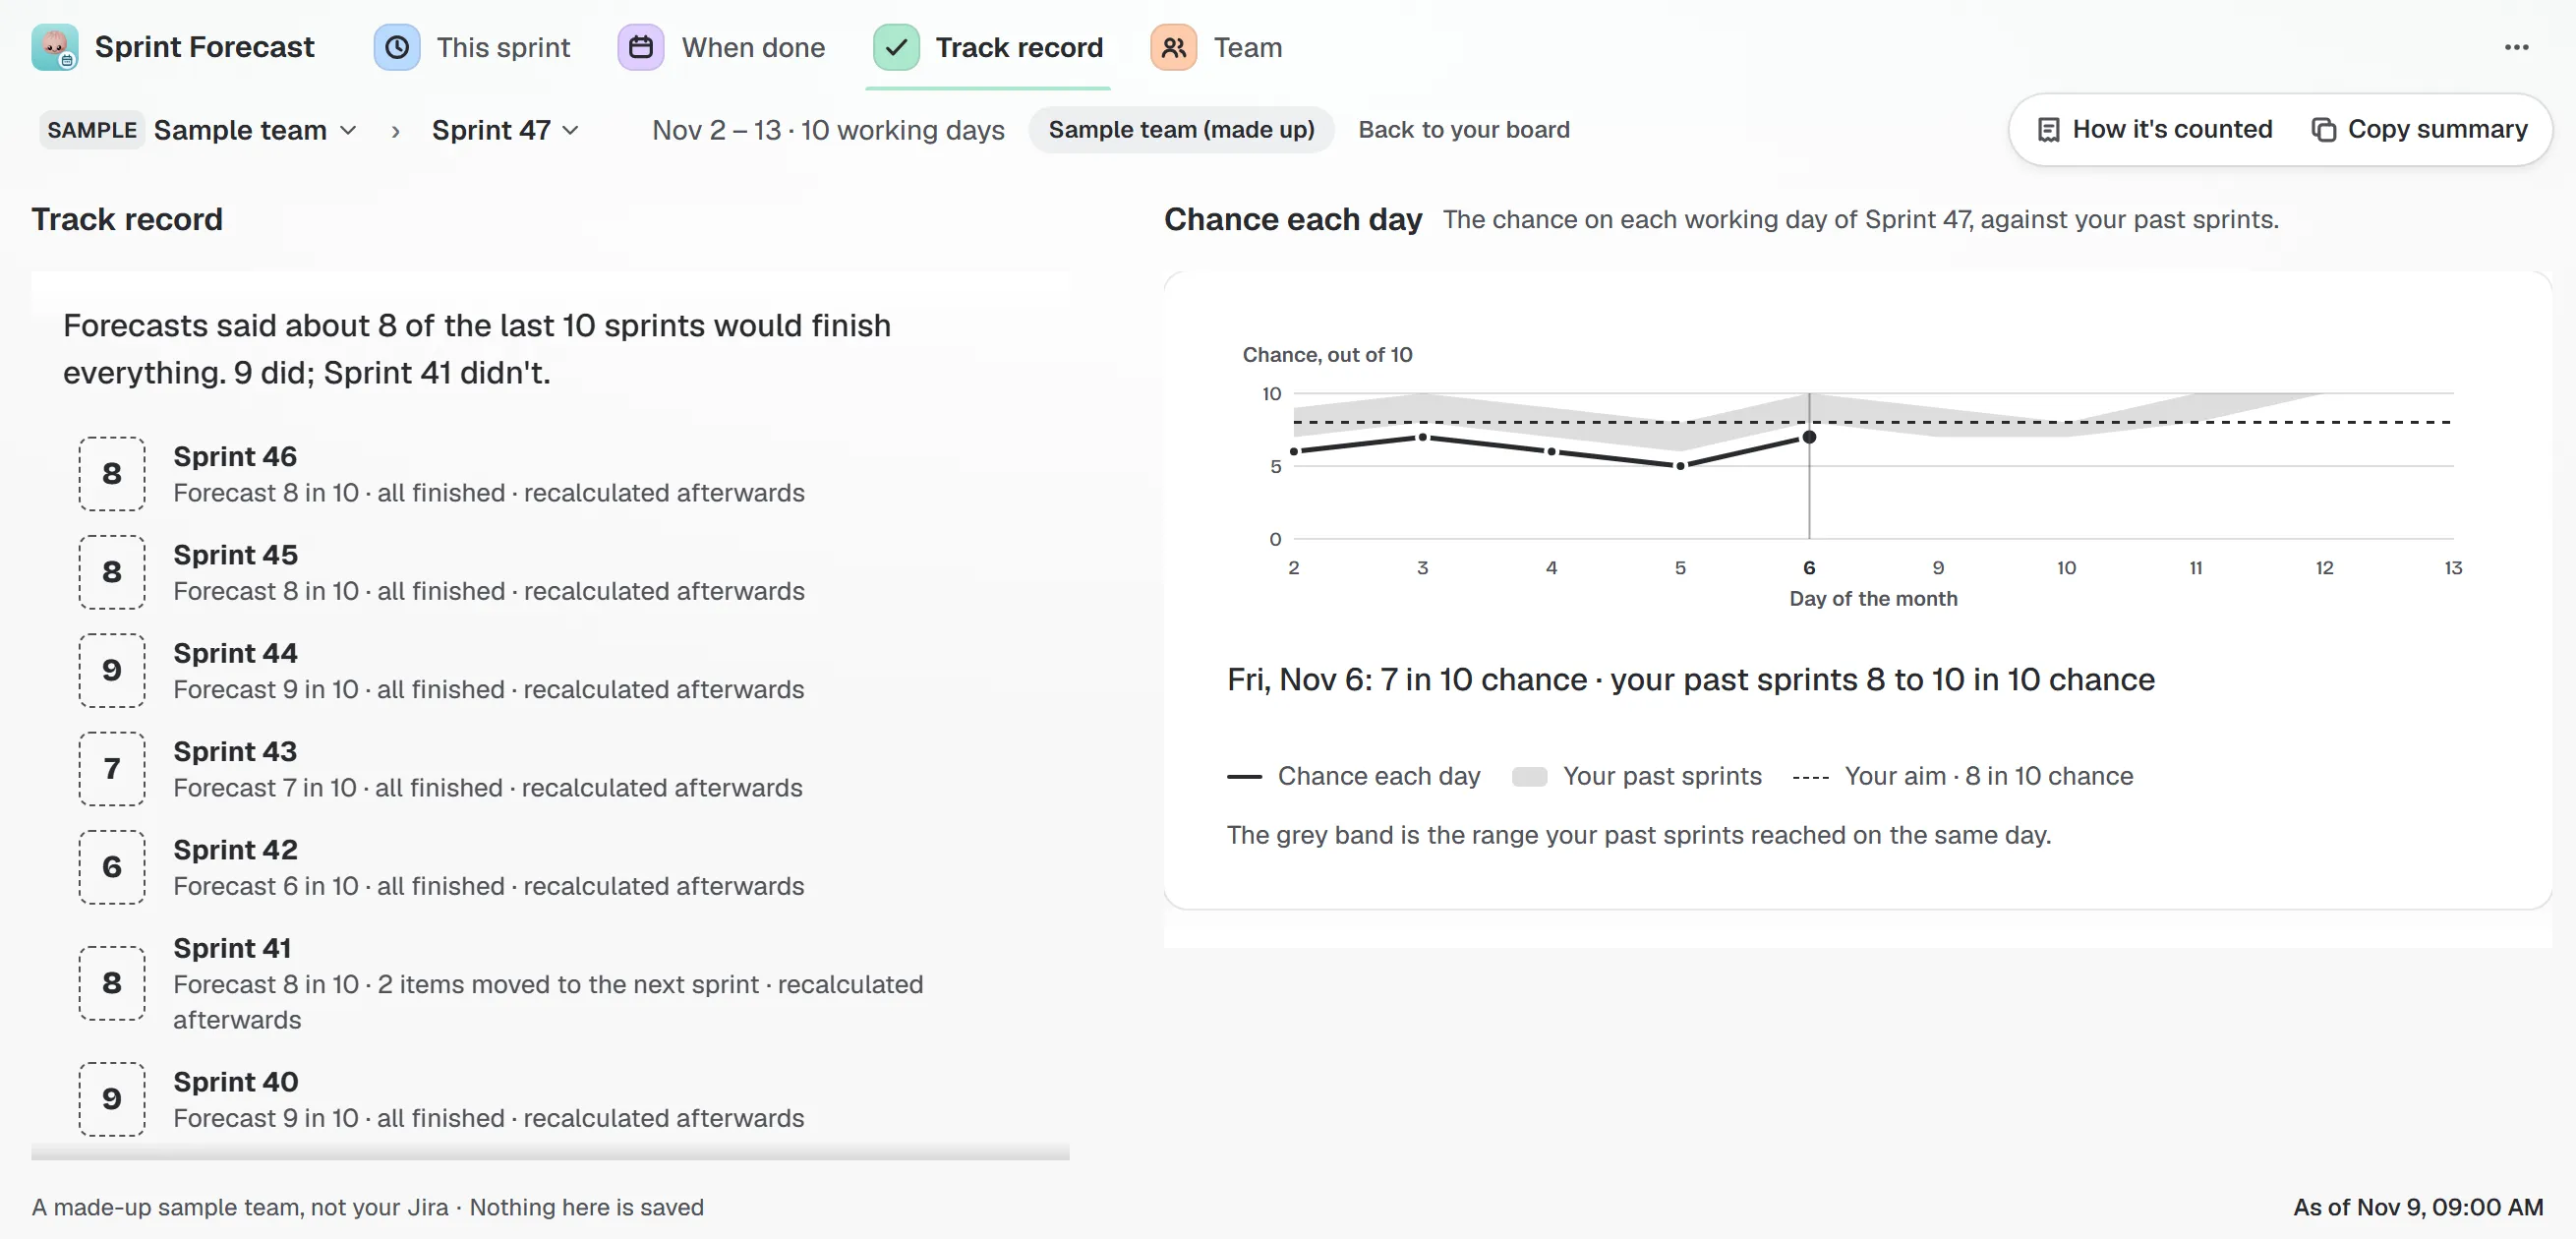
Sample team and sample data. Forecasts said about 8 of the last 10 sprints would finish everything; 9 did.
How do you say it in a meeting?
Short lines that survive a stakeholder:
- “In 8 of our last 10 sprints we would have finished this by Friday.”
- “It is about even. If we move two work items out, it becomes 8 in 10.”
- “I can say Friday with 8 in 10 confidence, or Monday with 9 in 10.”
- “This is a forecast from our own history. It is not a promise.”
Avoid “85% accurate” and “guaranteed”. The first sounds like the forecast itself has a score, which is a different thing. The second is the thing a forecast is not.
What can break a forecast?
Anything that makes the future differ from the past: a new team member, a big change of scope, a different kind of work. A forecast from your last ten sprints knows nothing about the eleventh. Look again when something changes, and treat a “too hopeful” note in Track record as a sign the team itself has changed.
For how a forecast gets built for one sprint, read Will we finish the sprint? For dates on epics and releases, see When will this epic or release be done?