


RequestOps · Explainer · 7 min read
Waiting time vs SLA time in Jira Service Management
By Jonas Nilsson · Published 13 October 2026
A manager sees that a request took more than a day. The SLA report says it was handled in four hours. The customer remembers waiting since Monday. Nobody is wrong: each number answers a different question. The trouble starts when one is read as if it were the other.
Three clocks, three questions
| Clock | What it counts | The question it answers |
|---|---|---|
| Elapsed time | Every hour from creation to resolution, nights and weekends included | How long did the customer wait for the outcome? |
| Waiting time by party | The same hours, split by who the request was waiting on: your team, the customer, another team, an approver or a vendor | Where did the time go, and who had the next step? |
| SLA time | Only the hours your SLA counts: within its calendar, and not while a pause condition applies | Did we meet the commitment we made, on the terms we set? |
The first two use the wall clock. The SLA uses rules that you configure.
How a Jira Service Management SLA clock works
An SLA in Jira Service Management is a set of rules on a service space:
- Start, pause and stop conditions. For example, the clock starts when the request is created, pauses while the status is Waiting for customer, and stops when the request is resolved.
- A calendar. Working days and hours, for example Monday to Friday, 09:00 to 17:00, plus holidays and a time zone. Time outside the calendar is not counted.
- Goals. For example, Time to resolution within 8 working hours for a given request type.
So an SLA is deliberately not a stopwatch. It counts the hours your rules say should count, within your working hours. That is why it cannot tell you how long the customer waited, or how much of the time sat with another team.
To check yours, open the service space’s settings and go to SLAs. Each goal names its calendar, and calendars have their own tab with working hours, holidays and a time zone.
A worked example
A fictional request, created on a Monday:
| From | To | Waiting on | Elapsed | Counts on the SLA clock |
|---|---|---|---|---|
| Mon 09:00 | Mon 10:00 | Your team (triage) | 1 h | 1 h |
| Mon 10:00 | Tue 10:00 | The customer (Waiting for customer) | 24 h | 0 h: paused |
| Tue 10:00 | Tue 12:00 | Another team (a linked task) | 2 h | 2 h |
| Tue 12:00 | Tue 13:00 | Your team (resolved at 13:00) | 1 h | 1 h |
| Total | 28 h | 4 h |
The SLA calendar here is Monday to Friday, 09:00 to 17:00, with no holidays. The SLA pauses while the status is Waiting for customer, and the goal is Time to resolution within 8 working hours.
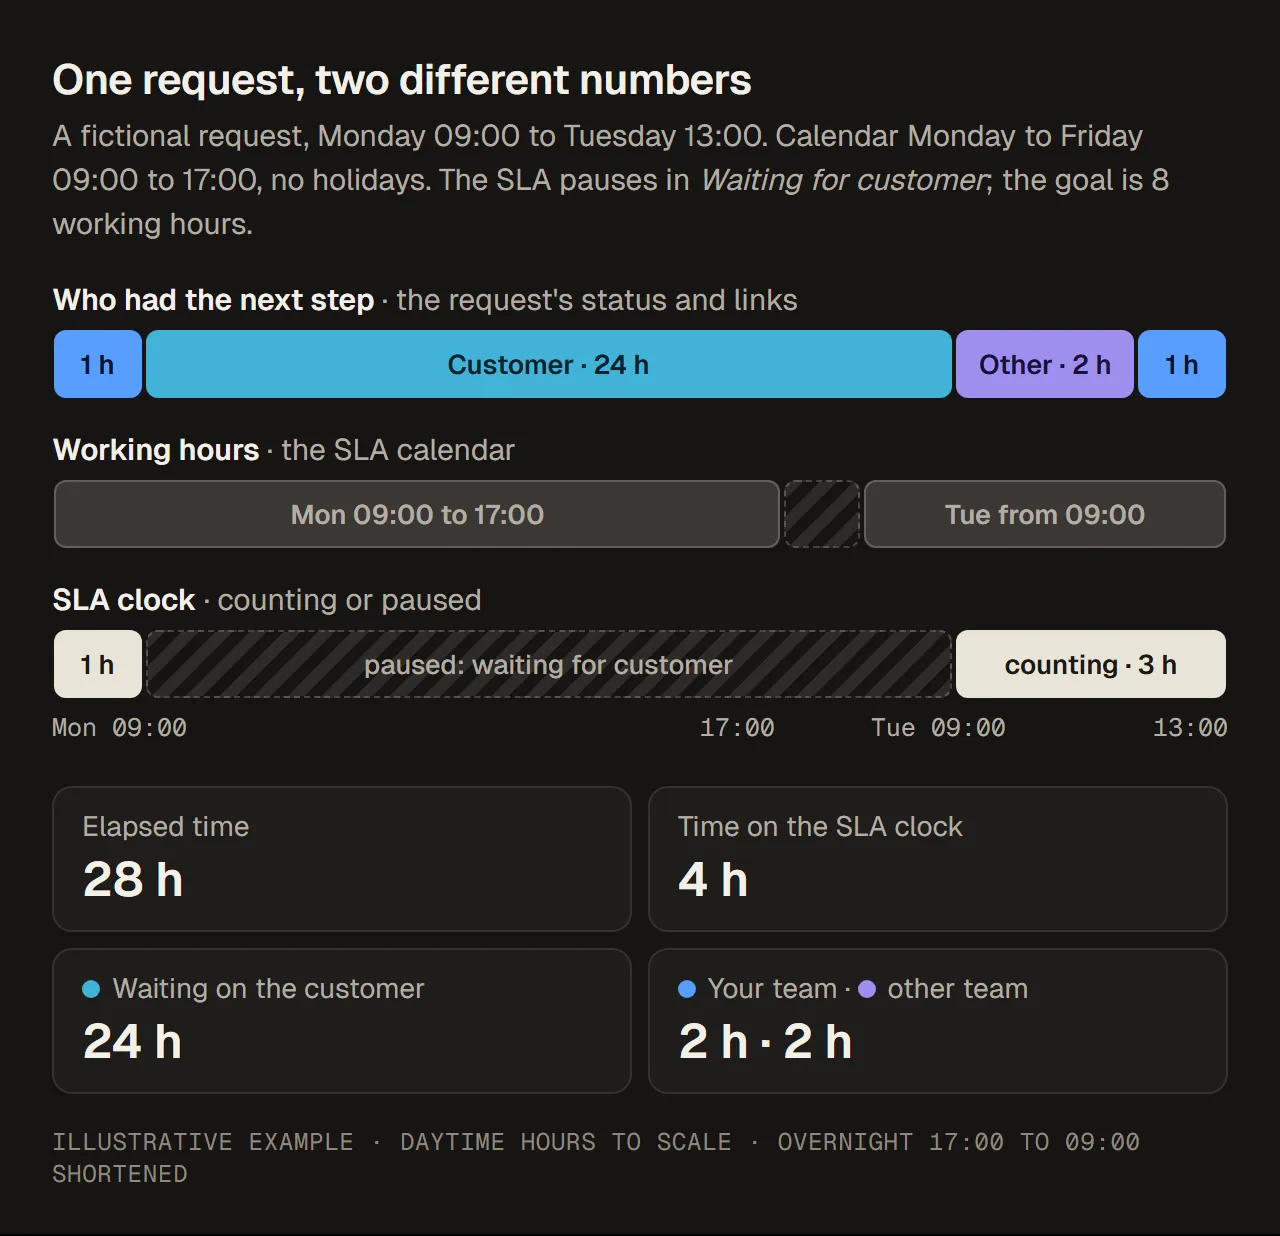
The same request on three rows. Illustrative example; daytime hours are to scale and the night is shortened.
Read the result three ways:
- Elapsed: 28 hours. That is what the customer experienced.
- By party: your team 2 h, the customer 24 h, another team 2 h. Most of the time, the next step was the customer’s.
- SLA: 4 hours. Against an 8-hour goal, the SLA was met.
Notice two things. First, 8 of the 24 customer hours fell inside working hours (Monday 10:00 to 17:00 and Tuesday 09:00 to 10:00). Only the pause condition kept them off the clock; the other 16 were outside the calendar anyway. Second, the two hours with the other team did count on the SLA clock, because nothing paused it. If your team regularly waits on other teams, the SLA shows that as your time, while waiting time shows whose it really was.
Common mistakes when comparing the numbers
- Reading SLA time as customer experience. A met SLA can still feel slow to a customer, especially when long waits are paused or fall outside working hours.
- Reading waiting time as idle work. Twenty-four hours “waiting on the customer” does not mean anyone was idle or slow. It means the next step was theirs.
- Blaming the team for another team’s time. If the SLA has no pause for handoffs, time on another team’s linked task counts against you. That is a reason to look at it, not a verdict.
- Comparing different calendars. Two spaces with different SLA calendars, or a report in business hours next to one on the wall clock, are not comparable.
- Ignoring how “waiting on” is decided. Party attribution depends on statuses, links and rules. If a status like In progress is used for “waiting on a vendor”, the attribution will be wrong until the rule is corrected.
Which number to use for which decision
| You want to know | Look at |
|---|---|
| Did we keep our promise? | SLA met or breached, per goal |
| How long did customers wait? | Elapsed time to resolution |
| Where should we act to speed things up? | Waiting time by party, and which requests waited longest |
| Is another team slowing us down? | Time waiting on other teams, and how often they answered |
| Are reminders worth sending? | Time waiting on the customer, before and after a follow-up |
The most useful view puts the SLA result next to the waiting split for the same requests and period. A breached request that spent most of its time waiting on an approver needs a different fix from one that sat in your own queue.
Before you trust any chart
Check these before acting on a waiting-time or SLA number, in any tool:
- The period and the spaces it covers, and whether both reports use the same ones.
- Business hours or wall clock. Say which one, and keep it the same across reports you compare.
- Where the history comes from. Status history in Jira, or changes recorded since an app was installed. Requests older than the history will be incomplete.
- How many requests a figure is based on. A percentage of five requests is not a trend.
- The SLA’s own configuration: calendar, pause conditions and goals, which may have changed during the period.
How RequestOps shows waiting time next to the SLA
RequestOps works out, for each request, who it is waiting on and for how long, and adds it up by party. In the worked example above, the request waited on others for 26 of its 28 hours (93%): 24 on the customer and 2 on another team. On Insights › Waiting, the headline says what share of request time was spent waiting on others, with a labelled bar for your team, customers, other teams, approvers and vendors, and the same split week by week.
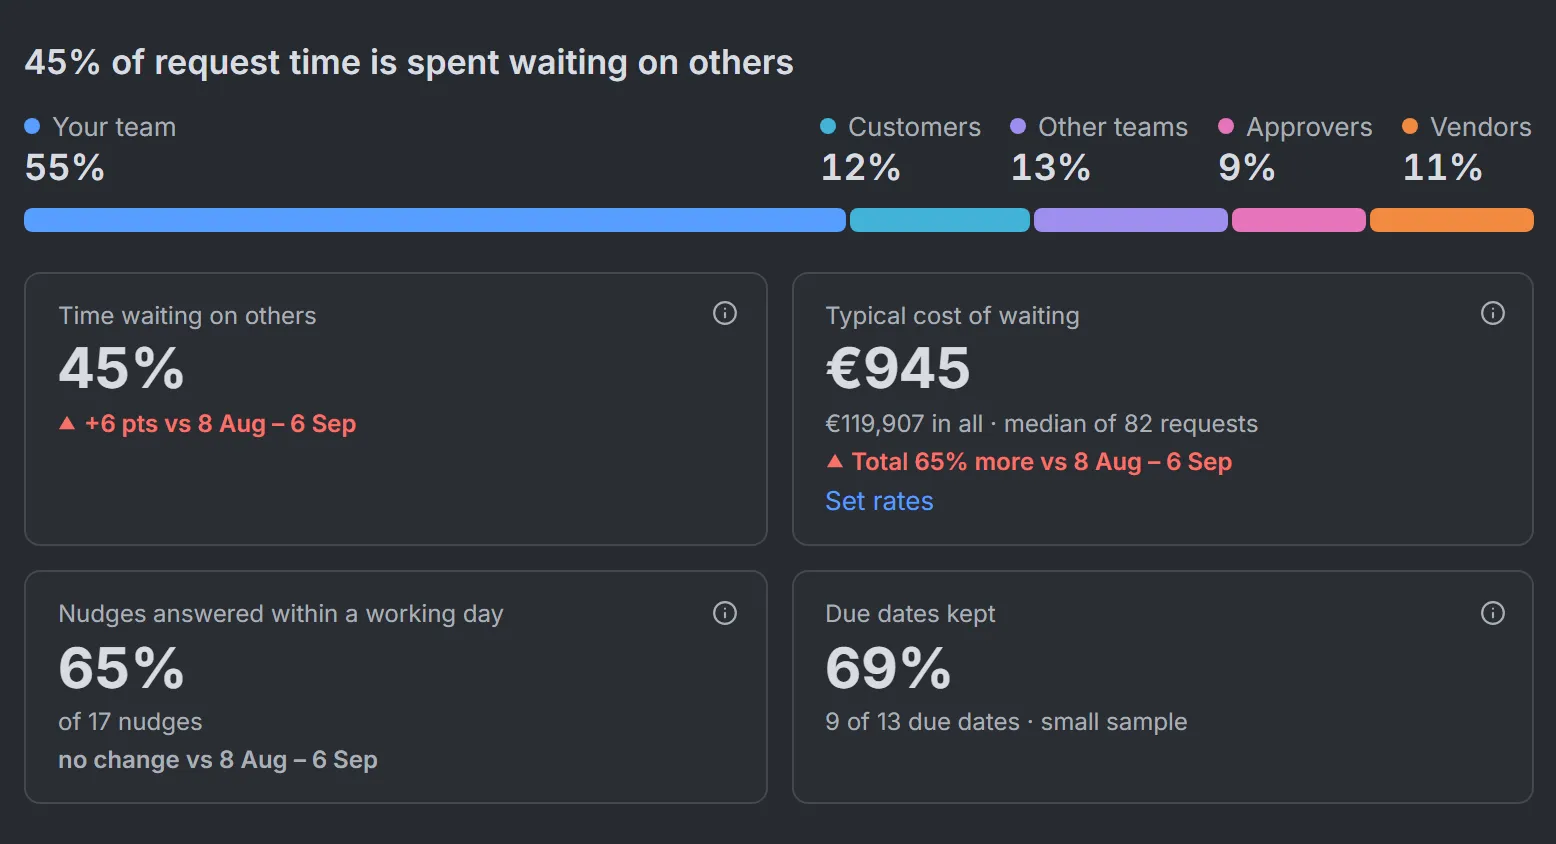
Insights › Waiting in RequestOps. Sample data, not the worked example above.
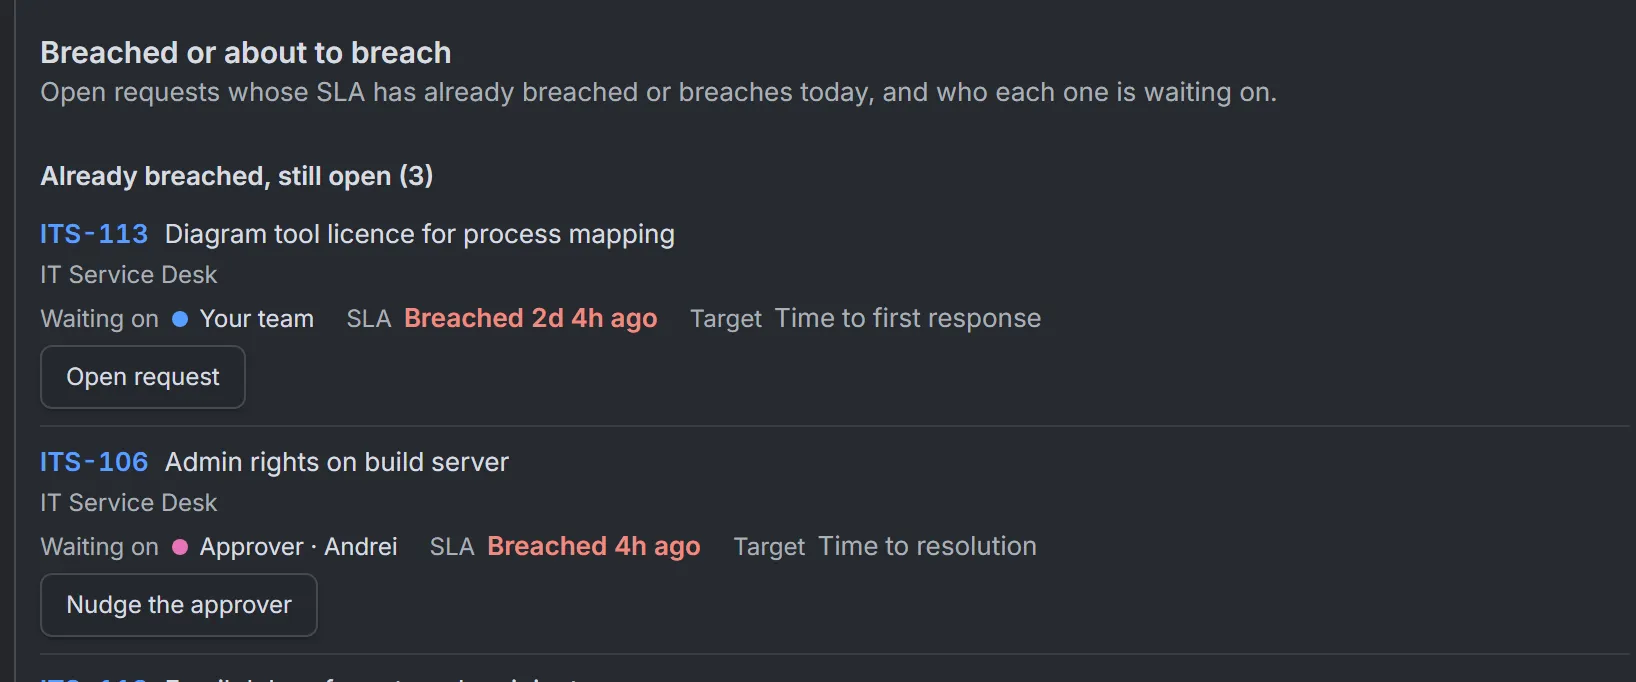
Insights › Overview: each breached request with who it is waiting on. Sample data.
On the Overview, the requests that breached or are about to breach their SLA are listed with who each one is waiting on, so you can see whether a breach happened on your side or while waiting on someone else. A Business hours switch counts only the working hours set in RequestOps (Settings › Time › Business hours). Set them to match your SLA calendar before comparing the two.
What it can and can’t tell you:
- Before RequestOps was installed, waiting time is an estimate from each request’s Jira status history, and the page says so. From installation on, it records who a request waits on as it happens.
- Statuses are matched to a party by name, for example Waiting for customer means the customer. If a guess is wrong, an admin corrects it in Settings › Time › Waiting time.
- SLA results count requests, not cycles. A request met its SLA if no cycle breached. Jira’s own SLA reports can count each SLA cycle, so a reopened request may count twice there, and the two percentages can differ slightly.
- Small samples are labelled as such instead of being turned into a trend.