


RequestOps · Guide · 6 min read
Monthly service review for Jira Service Management: agenda and template
By Jonas Nilsson · Published 13 October 2026
Many service reviews are a screen full of charts that nobody acts on. A useful one is short, honest about what the numbers can and cannot show, and ends with a few decisions. This guide gives you a structure, the questions behind each number, and an agenda you can copy.
Before the meeting: fix the scope
Decide these once, write them at the top of the review, and keep them the same from month to month:
- The period. A calendar month is easiest to compare. Say which dates, and which month you compare with.
- The spaces and request types. “All spaces” hides differences; one review per service is often clearer.
- Business hours or calendar time (24/7). Pick one for waiting and resolution times, and say which.
- What is not covered. Spaces without an SLA, requests from before your data starts, anything you filter out.
- Who comes. The team lead, one agent, and someone from each team you hand work to.
- Send the numbers a day ahead, so the meeting is spent on causes and decisions.
If any of these change, say so in the review. A number that moved because the scope moved is not a trend.
The numbers worth looking at
Keep it to a few numbers, each answering a question someone actually asks:
| Question | Number | Read it with care |
|---|---|---|
| Did we keep our promises? | SLA met, per SLA (for example Time to first response, Time to resolution) | Count requests or count SLA cycles, and say which: a reopened request can count twice. |
| Are we keeping up? | Requests created and resolved, by month | A month with more created than resolved grows the backlog. |
| How long do customers wait? | Median time to resolve | A median of few requests moves a lot. Note the sample size. |
| Where does the time go? | Share of time waiting on your team, customers, approvers, other teams and vendors | Needs a rule for which statuses mean waiting on the customer, an approver or another team. Jira doesn’t split time this way by itself. |
| What is stuck right now? | Open requests by who holds them, and the longest waits | A snapshot of today, not the month. |
| Are handoffs working? | How quickly other teams answer, and whether they meet their own due dates | Small numbers per team; look at counts, not just percentages. |
Waiting time and SLA time measure different things, and the difference matters in this meeting. Waiting time versus SLA time explains why with a worked example.
From numbers to requests
Numbers tell you where to look; requests tell you why. For each surprising number, open three to five real requests behind it:
- The breaches. For each SLA breach, who was the request waiting on when it breached? Your queue, an approver, another team, the customer?
- The longest waits that are still open. Is anyone working on them, and does the customer know?
- One request per pattern. If access requests spend most of their time waiting on approvers, open one and follow its history.
Write down what you find in plain words: “Three of six breaches happened while the request sat in our queue over the weekend”, not “SLA performance declined”.
Agree on next actions
A review without actions is a report. End with two or three actions, never ten. Each one needs:
- What will change, specifically (“name a backup approver for access requests”, “ask NetOps for due dates on linked tasks”).
- An owner, a single named person.
- A date by which it is done or reviewed.
- How you’ll know it worked, in next month’s numbers.
Next month, start the review with these actions, before any new number.
A 30-minute agenda you can copy
Monthly service review: {service} · {month}
Scope: {spaces}, {business hours or calendar time}. Compared with {previous month}.

1. Last month's actions (5 min)
   - For each: done / not done / effect seen in the numbers?

2. Headline numbers (5 min)
   - SLA met: {x of y}, change vs last month
   - Created vs resolved: {created} / {resolved}
   - Median time to resolve: {time} (based on {n} requests)
   - Time waiting on others: {share}, biggest: {party}

3. Look behind the numbers (10 min)
   - SLA breaches: who was each one waiting on?
   - Longest open waits: owner and next step for each
   - One pattern worth following: {request type / team}

4. Decide (8 min)
   - Action 1: {what} · owner {name} · by {date} · we'll know by {measure}
   - Action 2: {what} · owner {name} · by {date} · we'll know by {measure}

5. Notes on the data (2 min)
   - Anything missing, changed or uncertain this month
And a worksheet for the actions, to paste into a Confluence page or a spreadsheet:
| Action | Why (what we saw) | Owner | Due | How we’ll know |
|---|---|---|---|---|
| Example: name a backup approver for access requests | 3 of 6 breaches waited on an approver | {name} | {date} | Fewer breaches while waiting on an approver next month |
What Jira Service Management gives you natively
Jira Service Management has reports you can use for most of this review:
- Default reports: Workload, Satisfaction, Requests deflected and Requests resolved.
- Ready-made custom reports: Created vs resolved, Time to resolution, SLA met vs breached and SLA success rate, among others. Space admins can create and change custom reports, with up to 20 series each.
- Export: work item search exports to CSV, up to 10,000 work items at a time.
- Atlassian Analytics for cross-space dashboards, which Atlassian announced as included with Enterprise plans.
None of the reports above splits a request’s time by who it was waiting on, or shows who a breached request was waiting on when it breached. Without an app, start with the breaches: open each breached request’s history and note the status it was in when the SLA breached. With a handful of breaches a month, this takes a few minutes. For the median, export the month’s resolved work items with their Created and Resolved dates to a spreadsheet.
Sources: Atlassian, default reports, custom reports, creating custom reports, exporting over 10,000 work items, Atlassian Analytics, checked 13 October 2026.
The monthly review in RequestOps
RequestOps puts this review on one page: Insights › Overview › Review for your manager. It opens on last month by default, and works for any period you choose.
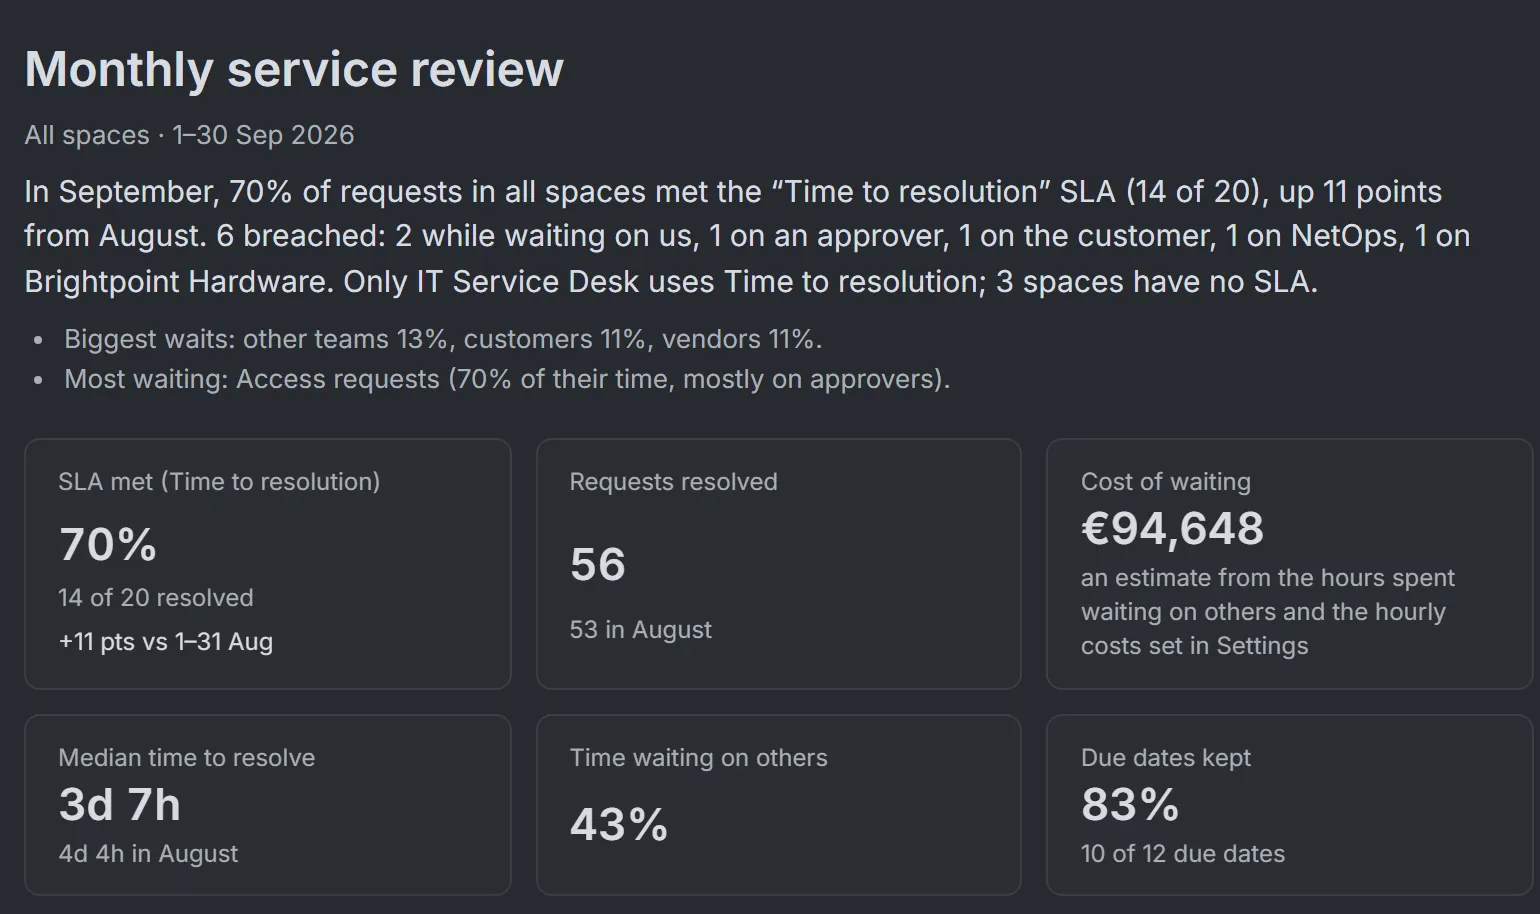
The top of the review for September. Only one of four spaces has an SLA, so “SLA met” counts 20 requests while 56 were resolved. That is the scope note from the start of this guide in action. Sample data.
The page starts with one sentence that answers “how did we do?”, followed by the numbers above, and then six sections, each opening with its own answer:
- SLA met: every SLA, with a six-month trend.
- Breaches, by who requests waited on when they breached.
- Open requests now, by who holds them, with the ten longest waits.
- Created and resolved, by month, over six months.
- Due dates kept and nudges answered, per team.
- Waiting on customers and time with your team.
A section that can’t be measured yet says so instead of showing zero. Definitions are included, and the footer states whether times are in business hours or calendar time, and how many requests the figures are based on. The cost of waiting tile only appears once someone has set hourly costs in Settings › Time › Waiting time.
To share it, use the Share menu. Excel comes with summary, detail and definitions sheets, and the PDF is a one-page report:
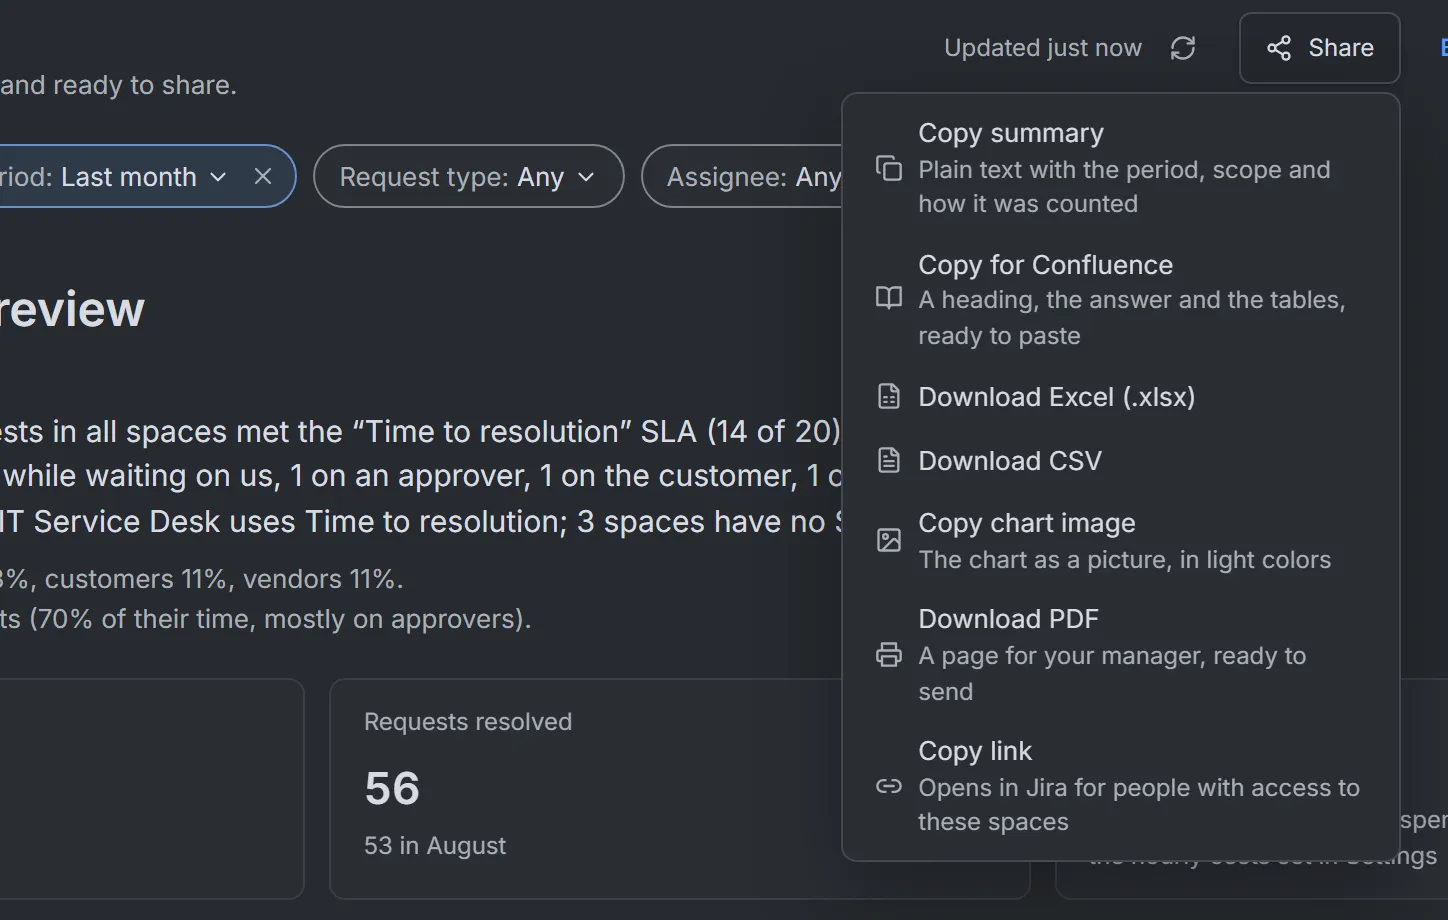
Every way to share the review. Sample data.
Reports say they were made with RequestOps; an admin can switch that line off in Settings › Messages. People appear as roles such as “an approver” or “your team”, never by name, and per-person numbers are never exported.